注解
Click here 下载完整的示例代码
复杂语义图形构成
警告
本教程介绍了实验/临时API。我们在v3.3中发布这个版本是为了获得用户反馈。我们可能会在没有任何警告的情况下对未来的版本进行突破性的更改。
在非均匀网格中布置图形中的轴既繁琐又冗长。对于密集的,甚至是我们有的网格 Figure.subplots 但是对于更复杂的布局,例如跨布局的多个列/行的轴或图的某些区域留空的轴,可以使用 gridspec.GridSpec (见 使用GRIDSPEC和其他功能自定义图形布局 )或者手动放置轴。 Figure.subplot_mosaic 旨在提供一个界面,以直观地布局您的轴(作为ASCII艺术或嵌套列表)以简化此过程。
此接口自然支持命名轴。 Figure.subplot_mosaic 返回在用于布局地物的标签上键入的字典。通过返回带有名称的数据结构,编写独立于地物布局的绘图代码更容易。
灵感来源于 proposed MEP 以及 patchwork 虽然我们没有实现操作符重载样式,但是我们提供了一个pythonicapi来指定(嵌套的)轴布局。
import matplotlib.pyplot as plt
import numpy as np


# Helper function used for visualization in the following examples
def identify_axes(ax_dict, fontsize=48):
    """
    Helper to identify the Axes in the examples below.

    Draws the label in a large font in the center of the Axes.

    Parameters
    ----------
    ax_dict : Dict[str, Axes]
        Mapping between the title / label and the Axes.

    fontsize : int, optional
        How big the label should be
    """
    kw = dict(ha="center", va="center", fontsize=fontsize, color="darkgrey")
    for k, ax in ax_dict.items():
        ax.text(0.5, 0.5, k, transform=ax.transAxes, **kw)
如果我们想要2x2的网格,我们可以使用 Figure.subplots 返回一个 axes.Axes 我们可以用索引来做绘图。
np.random.seed(19680801)
hist_data = np.random.randn(1_500)


fig = plt.figure(constrained_layout=True)
ax_array = fig.subplots(2, 2, squeeze=False)

ax_array[0, 0].bar(['a', 'b', 'c'], [5, 7, 9])
ax_array[0, 1].plot([1, 2, 3])
ax_array[1, 0].hist(hist_data, bins='auto')
ax_array[1, 1].imshow([[1, 2], [2, 1]])

identify_axes(
    {(j, k): a for j, r in enumerate(ax_array) for k, a in enumerate(r)}
)

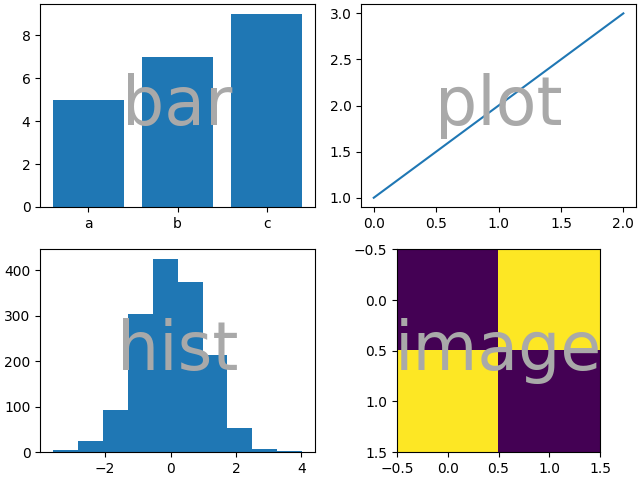
使用 Figure.subplot_mosaic 我们可以产生相同的布局,但给轴语义名称
fig = plt.figure(constrained_layout=True)
ax_dict = fig.subplot_mosaic(
    [['bar',  'plot'],
     ['hist', 'image']])
ax_dict['bar'].bar(['a', 'b', 'c'], [5, 7, 9])
ax_dict['plot'].plot([1, 2, 3])
ax_dict['hist'].hist(hist_data)
ax_dict['image'].imshow([[1, 2], [2, 1]])
identify_axes(ax_dict)
两者之间的关键区别 Figure.subplots 和 Figure.subplot_mosaic 是返回值。前者返回用于索引访问的数组,后者返回将标签映射到 axes.Axes 创建的实例
print(ax_dict)
出:
{'image': <AxesSubplot:label='image'>, 'bar': <AxesSubplot:label='bar'>, 'hist': <AxesSubplot:label='hist'>, 'plot': <AxesSubplot:label='plot'>}
弦式速记
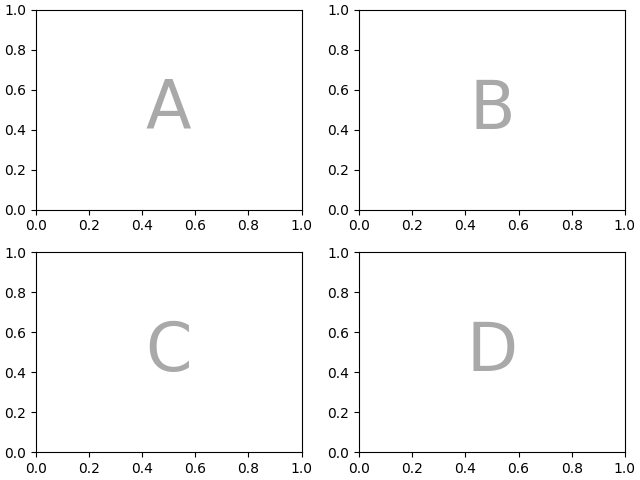
通过限制我们的轴标签为单个字符,我们可以使用,我们可以“画”轴,我们希望作为“ASCII艺术”。以下
layout = """
    AB
    CD
    """
将给我们4轴在一个2x2的网格布局,并生成与上述相同的图形布局(但现在标记为 {{"A", "B", "C", "D"}} 而不是 {{"bar", "plot", "hist", "image"}} )
fig = plt.figure(constrained_layout=True)
ax_dict = fig.subplot_mosaic(layout)
identify_axes(ax_dict)
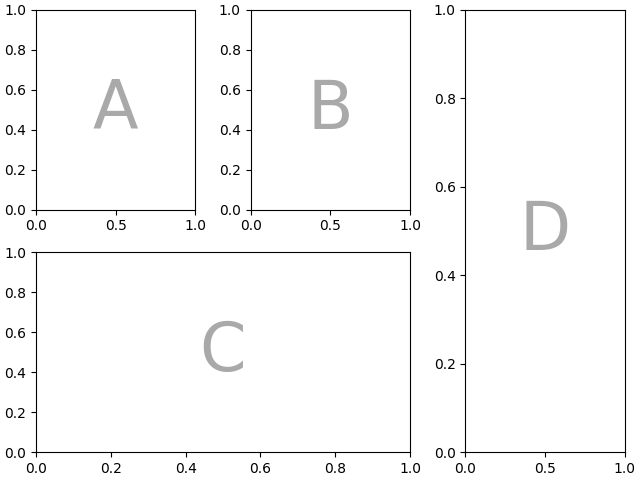
我们能做些什么 Figure.subplot_mosaic 你无法忍受的 Figure.subplots 指定轴应跨多行或多列。
如果我们想把四个轴重新排列,使C在底部是水平跨度,D在右边是垂直跨度,我们可以这样做
axd = plt.figure(constrained_layout=True).subplot_mosaic(
    """
    ABD
    CCD
    """
)
identify_axes(axd)
如果我们不想用轴来填充图形中的所有空格,我们可以指定网格中的一些空格为空
axd = plt.figure(constrained_layout=True).subplot_mosaic(
    """
    A.C
    BBB
    .D.
    """
)
identify_axes(axd)
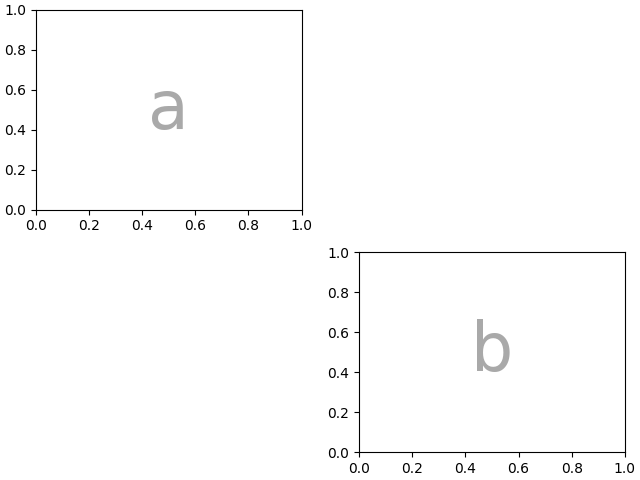
如果我们喜欢使用另一个字符(而不是句点 "." )我们可以用 empty_sentinel 指定要使用的字符。
axd = plt.figure(constrained_layout=True).subplot_mosaic(
    """
    aX
    Xb
    """,
    empty_sentinel="X",
)
identify_axes(axd)
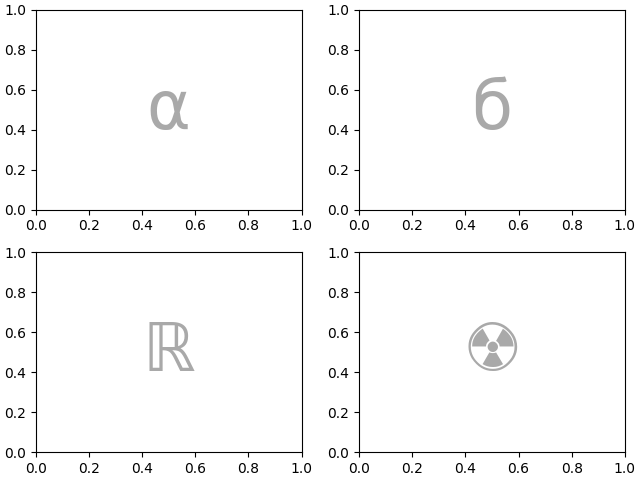
在内部,我们使用的字母没有任何意义,任何Unicode代码点都是有效的!
axd = plt.figure(constrained_layout=True).subplot_mosaic(
    """αб
       ℝ☢"""
)
identify_axes(axd)
不建议使用空白作为标签或字符串速记的空哨兵,因为在处理输入时可能会将其剥离。
控制布局和子地块创建
此功能建立在 gridspec 您可以将关键字参数传递给底层 gridspec.GridSpec (同 Figure.subplots )
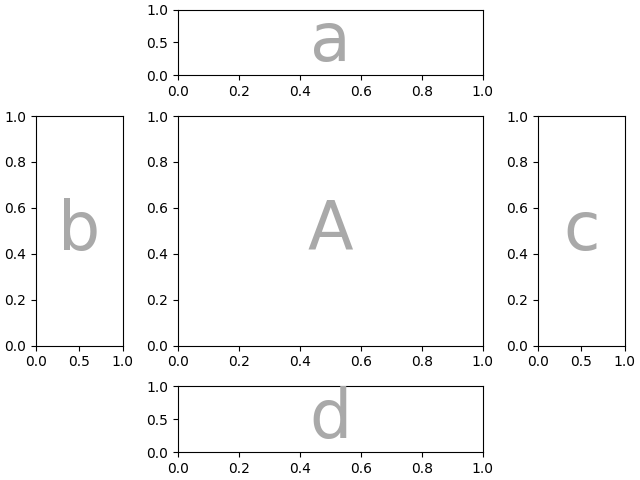
在这种情况下,我们希望使用输入来指定排列,但是通过设置行/列的相对宽度 gridspec_kw .
axd = plt.figure(constrained_layout=True).subplot_mosaic(
    """
    .a.
    bAc
    .d.
    """,
    gridspec_kw={
        # set the height ratios between the rows
        "height_ratios": [1, 3.5, 1],
        # set the width ratios between the columns
        "width_ratios": [1, 3.5, 1],
    },
)
identify_axes(axd)
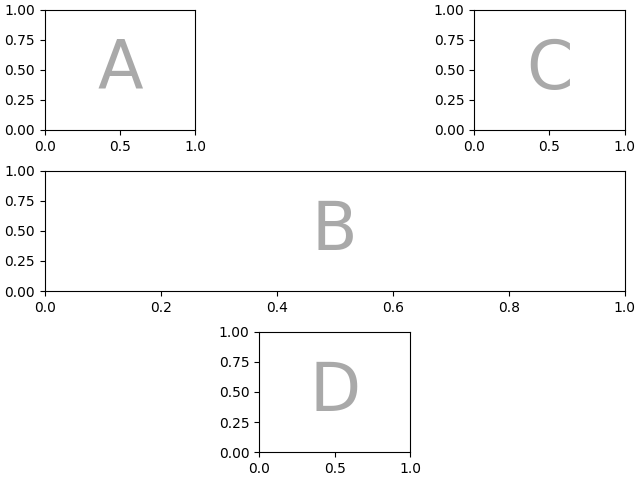
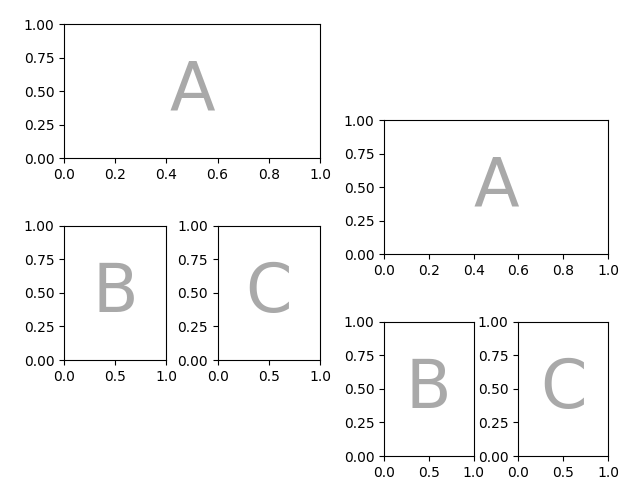
或者使用{ left , 正确的 , 底部 , top }关键字参数来定位整个布局,以便在图形中放置同一布局的多个版本
layout = """AA
            BC"""
fig = plt.figure()
axd = fig.subplot_mosaic(
    layout,
    gridspec_kw={
        "bottom": 0.25,
        "top": 0.95,
        "left": 0.1,
        "right": 0.5,
        "wspace": 0.5,
        "hspace": 0.5,
    },
)
identify_axes(axd)

axd = fig.subplot_mosaic(
    layout,
    gridspec_kw={
        "bottom": 0.05,
        "top": 0.75,
        "left": 0.6,
        "right": 0.95,
        "wspace": 0.5,
        "hspace": 0.5,
    },
)
identify_axes(axd)
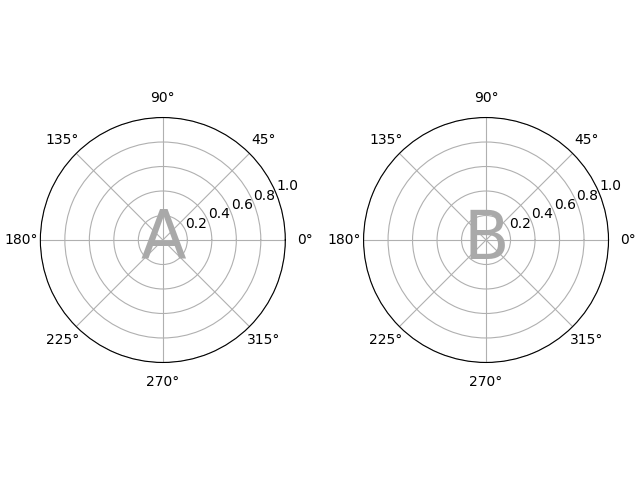
我们还可以传递用于创建子图的参数(同样,与 Figure.subplots )
axd = plt.figure(constrained_layout=True).subplot_mosaic(
    "AB", subplot_kw={"projection": "polar"}
)
identify_axes(axd)
嵌套列表输入
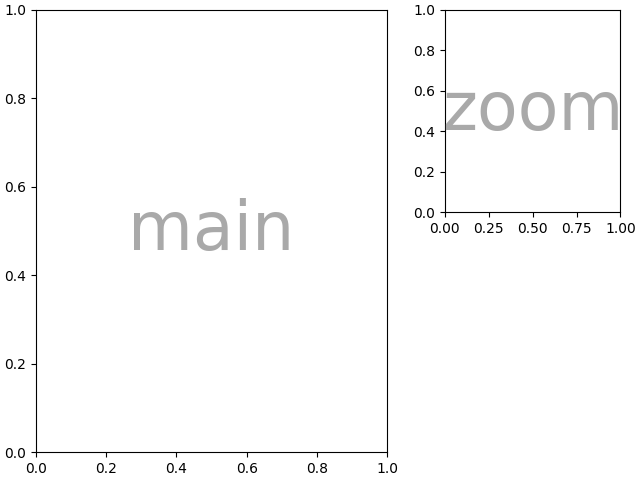
使用字符串速记可以做的所有事情我们在传递列表时也可以做(在内部我们将字符串速记转换为嵌套列表),例如使用跨距、空格和空格 gridspec_kw :
axd = plt.figure(constrained_layout=True).subplot_mosaic(
    [["main", "zoom"],
     ["main", "BLANK"]
     ],
    empty_sentinel="BLANK",
    gridspec_kw={"width_ratios": [2, 1]}
)
identify_axes(axd)
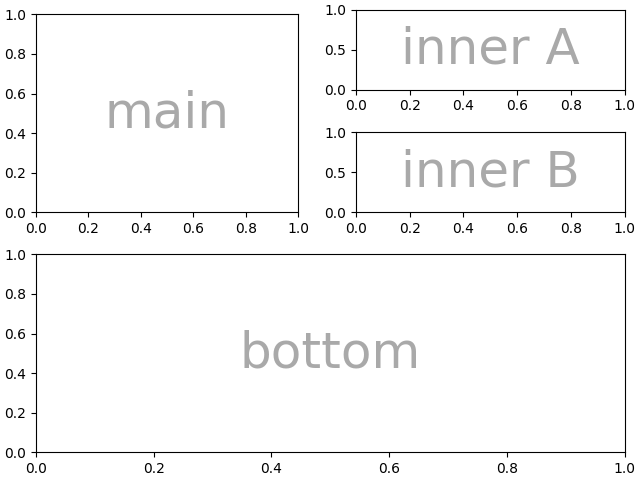
此外,使用列表输入可以指定嵌套布局。内部列表的任何元素都可以是另一组嵌套列表:
inner = [
    ["inner A"],
    ["inner B"],
]

outer_nested_layout = [
    ["main", inner],
    ["bottom", "bottom"],
]
axd = plt.figure(constrained_layout=True).subplot_mosaic(
    outer_nested_layout, empty_sentinel=None
)
identify_axes(axd, fontsize=36)
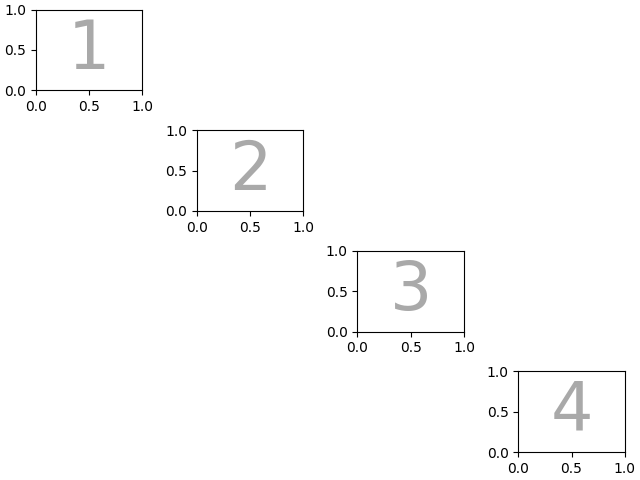
我们还可以传入一个2D NumPy数组来执行以下操作
脚本的总运行时间: (0分7.314秒)
关键词:matplotlib代码示例,codex,python plot,pyplot Gallery generated by Sphinx-Gallery