注解
点击 here 下载完整的示例代码
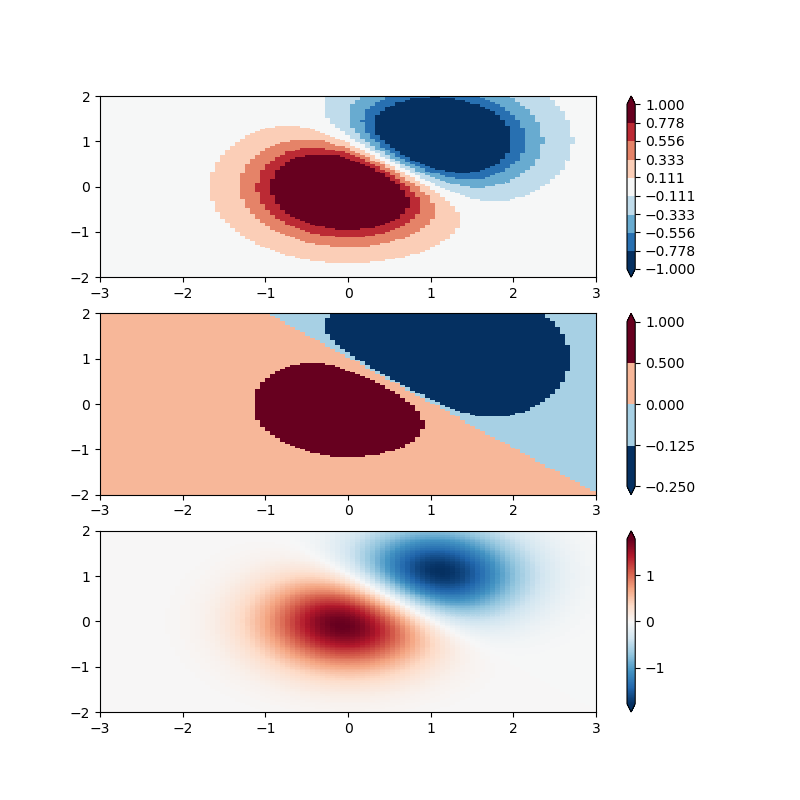
颜色映射规范化界限
演示如何使用norm以非线性方式将颜色映射到数据上。
import numpy as np
import matplotlib.pyplot as plt
import matplotlib.colors as colors

N = 100
X, Y = np.mgrid[-3:3:complex(0, N), -2:2:complex(0, N)]
Z1 = np.exp(-X**2 - Y**2)
Z2 = np.exp(-(X - 1)**2 - (Y - 1)**2)
Z = (Z1 - Z2) * 2

'''
BoundaryNorm: For this one you provide the boundaries for your colors,
and the Norm puts the first color in between the first pair, the
second color between the second pair, etc.
'''

fig, ax = plt.subplots(3, 1, figsize=(8, 8))
ax = ax.flatten()
# even bounds gives a contour-like effect
bounds = np.linspace(-1, 1, 10)
norm = colors.BoundaryNorm(boundaries=bounds, ncolors=256)
pcm = ax[0].pcolormesh(X, Y, Z,
                       norm=norm,
                       cmap='RdBu_r')
fig.colorbar(pcm, ax=ax[0], extend='both', orientation='vertical')

# uneven bounds changes the colormapping:
bounds = np.array([-0.25, -0.125, 0, 0.5, 1])
norm = colors.BoundaryNorm(boundaries=bounds, ncolors=256)
pcm = ax[1].pcolormesh(X, Y, Z, norm=norm, cmap='RdBu_r')
fig.colorbar(pcm, ax=ax[1], extend='both', orientation='vertical')

pcm = ax[2].pcolormesh(X, Y, Z, cmap='RdBu_r', vmin=-np.max(Z))
fig.colorbar(pcm, ax=ax[2], extend='both', orientation='vertical')

plt.show()
关键词:matplotlib代码示例,codex,python plot,pyplot Gallery generated by Sphinx-Gallery