4.2. Lesson: 创建动态打印布局
现在您已经学会了创建基本的地图布局,我们将更进一步,创建一个能够动态适应地图范围和页面属性的地图布局,例如,当您更改页面大小时。此外,创建日期将动态调整。
4.2.1.  Follow Along: Creating the dynamic map canvas
加载ESRI shapefile格式的数据集
protected_areas.shp,places.shp,rivers.shp和water.shp添加到地图画布中,并调整其属性以适应您自己的方便。After everything is rendered and symbolized to your liking, click the
 New Print Layout icon in the Project toolbar
or choose .
You will be prompted to choose a title for the new print layout.
New Print Layout icon in the Project toolbar
or choose .
You will be prompted to choose a title for the new print layout.我们想创建一个由标题和南非斯韦伦达姆附近地区的地图组成的地图布局。布局的边距应为7.5 mm,页眉高度应为36 mm。
创建名为的地图项目
main map在画布上并转到 Layout 面板。向下滚动到 Variables 部分,并找到 Layout 一部份。这里我们设置了一些变量,您可以在整个动态打印布局中使用这些变量。转到 Layout 面板,然后向下滚动到 Variables 一节。第一个变量将定义边距。按下按钮 按钮,然后键入名称
 sw_layout_margin。将该值设置为7.5。按下按钮 按钮,然后输入名称 sw_layout_height_header。将该值设置为36。现在,您已经准备好通过变量自动创建地图画布的位置和大小。确保您的地图项目已选中,请转到 Item Properties 面板中,向下滚动到并打开 Position and Size 一节。单击
 Data defined override 为 X 而从 Variables 进入,选择
 @sw_layout_margin。单击
Data defined override 为 Y ,选择 Edit... 并键入公式::to_real(@sw_layout_margin) + to_real(@sw_layout_height_header)
您可以使用的变量创建地图项的大小 Width 和 Height 。单击
Data defined override 为 Width 并选择 Edit ... 再来一次。填写公式::@layout_pagewidth - @sw_layout_margin * 2
单击
Data defined override 为 Height 并选择 Edit ... 。在此填写公式::@layout_pageheight - @sw_layout_height_header - @sw_layout_margin * 2
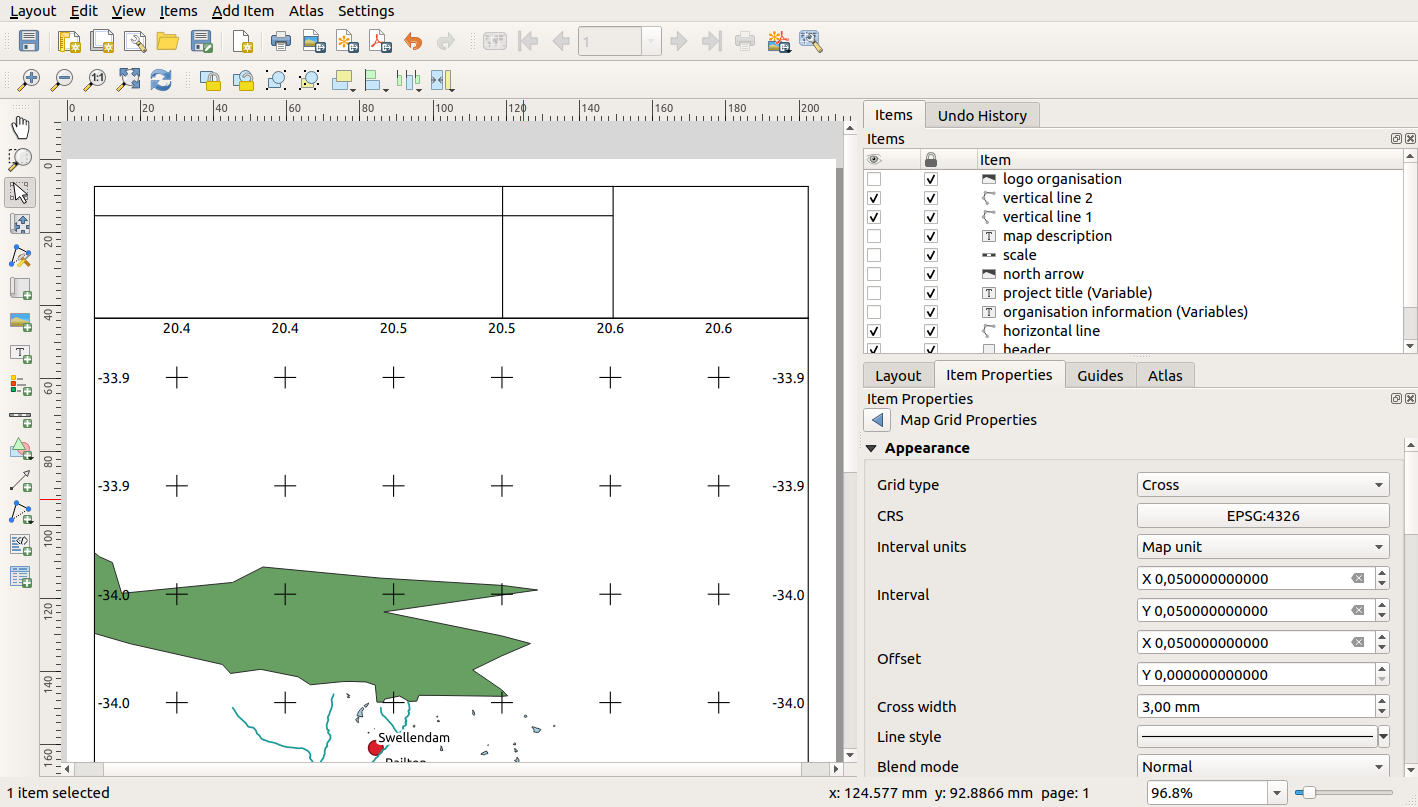
我们还将创建一个包含主画布地图范围坐标的网格。去 Item Properties 再次选择并选择 Grids 一节。通过单击
纽扣。点击 Modify grid ... 并将 Interval 为 X , Y 和 Offset 根据您在QGIS主画布中选择的地图比例。这个 Grid type Cross 非常适合我们的目的。
4.2.2. Follow Along: Creating the dynamic header
插入一个矩形,该矩形将包含带有
 Add Shape 纽扣。在 Items 面板输入名称
 header。同样,请转到 Item Properties 并打开 Position and Size 一节。vbl.使用
Data defined override ,请选择 sw_layout_margin变量For X 以及为了 Y 。 Width 应由以下表述来定义:@layout_pagewidth - @sw_layout_margin * 2
和 Height 由.
sw_layout_height_header变量。我们将插入一条水平线和两条垂直线,以使用
 Add Node Item 。创建一条水平线和两条垂直线并将其命名
 Horizontal line,Vertical line 1Vertical line 2。对于水平线:
集 X 添加到变量
sw_layout_margin将表达式设置为 Y 致:
@sw_layout_margin + 8
将表达式设置为 Width 致:
@layout_pagewidth - @sw_layout_margin * 3 - 53.5
对于第一条垂直线:
将表达式设置为 X 致:
@layout_pagewidth - @sw_layout_margin * 2 - 53.5
集 Y 添加到变量
sw_layout_margin高度必须与我们创建的页眉相同,因此设置 Height 添加到变量
sw_layout_height_header。
第二条垂直线放置在第一条垂直线的左侧。
将表达式设置为 X 致:
@layout_pagewidth - @sw_layout_margin * 2 - 83.5
集 Y 添加到变量
sw_layout_margin高度应与另一条垂直线相同,因此设置 Height 添加到变量
sw_layout_height_header。
下图显示了我们的动态布局的结构。我们将在线条创建的区域中填充一些元素。
4.2.3. Follow Along: Creating labels for the dynamic header
您的QGIS项目的标题可以自动包括在内。标题设置在 Project Properties 。插入带有以下选项的标签
 Add Label 按钮,然后输入名称
 project title (variable)。在 Main Properties 的 Items Properties 面板输入表达式::[%@project_title%]
设置标签的位置。
为 X ,请使用表达式::
@sw_layout_margin + 3
为 Y ,请使用表达式::
@sw_layout_margin + 0.25
为 Width ,请使用表达式::
@layout_pagewidth - @sw_layout_margin *2 - 90
请输入
11.25为 Height
在……下面 Appearance 将字体大小设置为16磅。
第二个标签将包括对您创建的地图的描述。同样,插入一个标签并将其命名
map description。在 Main Properties 输入文本map description。在 Main Properties 我们还将包括:printed on: [%format_date(now(),'dd.MM.yyyy')%]
在这里,我们使用了两个
Date and Time功能 (now和format_date)。设置标签的位置。
为 X ,请使用表达式::
@sw_layout_margin + 3
为 Y ,请使用表达式::
@sw_layout_margin + 11.5
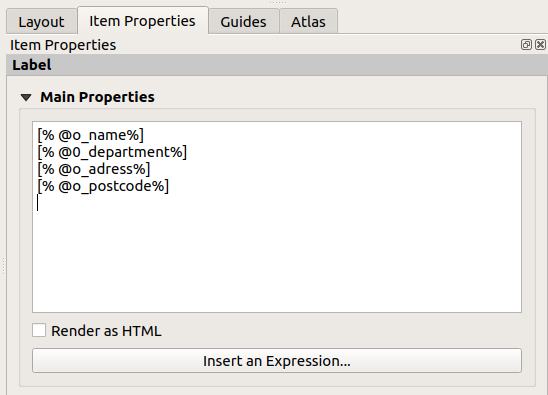
第三个标签将包括有关您的组织的信息。首先,我们将在 Variables 菜单中的 Item Properties 。转到 Layout 菜单中,单击
按钮,并输入名称 o_department,o_name,o_adress和o_postcode。在第二行中输入有关您的组织的信息。我们将在 Main Properties 一节。在……里面 Main Properties 输入::
[% @o_name %]
[% @o_department %]
[% @o_adress %]
[% @o_postcode %]
设置标签的位置。
为 X ,请使用表达式::
@layout_pagewidth - @sw_layout_margin - 49.5
为 Y ,请使用表达式::
@sw_layout_margin + 15.5
为 Width ,使用
49.00为 Height ,请使用表达式::
@sw_layout_height_header - 15.5
4.2.4. Follow Along: Adding pictures to the dynamic header
使用
 Add Picture 按钮将图片放在标签上方
 organisation information。在输入名称后organisation logo定义徽标的位置和大小:为 X ,请使用表达式::
@layout_pagewidth - @sw_layout_margin - 49.5
为 Y ,请使用表达式::
@sw_layout_margin + 3.5
为 Width ,使用
39.292为 Height ,使用
9.583
要包括贵组织的徽标,您必须将徽标保存在主目录下,然后在下输入路径 。
我们的布局仍然需要一个指北针。这也将通过使用以下命令插入
 Add North Arrow 。我们将使用默认的指北针。定义职位:
为 X ,请使用表达式::
@layout_pagewidth - @sw_layout_margin * 2 - 78
为 Y ,请使用表达式::
@sw_layout_margin + 9
为 Width ,使用
21.027为 Height ,使用
21.157
4.2.5. Follow Along: Creating the scalebar of the dynamic header
要在标题中插入比例尺,请单击
 Add Scale Bar 并将其放置在指北针上方的矩形中。在……里面 Map 在 Main Properties 选择您的
 main map(Map 1)。这意味着比例会根据您在QGIS主画布中选择的范围自动更改。选择 Style Numeric 。这意味着我们插入一个不带比例尺的简单比例尺。天平还需要一个位置和大小。为 X ,请使用表达式::
@layout_pagewidth - @sw_layout_margin * 2 - 78
为 Y ,请使用表达式::
@sw_layout_margin + 1
为 Width ,使用
25为 Height ,使用
8请将
Reference point在中间。
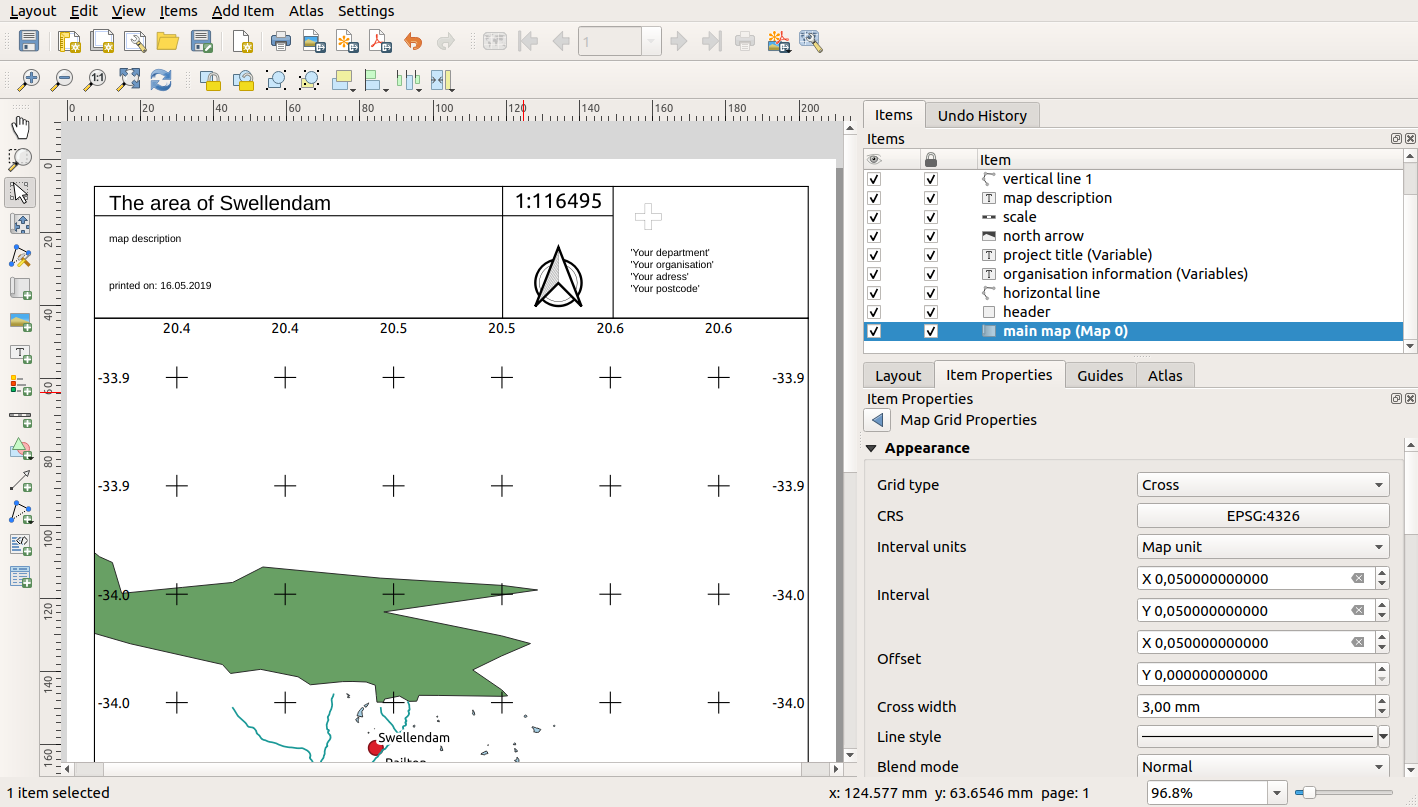
祝贺你!您已经创建了您的第一个动态地图布局。看一看布局,检查是否一切看起来都像你想要的那样!更改时,动态地图布局会自动做出反应 page properties 。例如,如果将页面大小从DIN A4更改为DIN A3,请单击  Refresh view 按钮,并对页面设计进行了调整。
4.2.6. What's Next?
在下一页,将给你布置一项要完成的作业。这会让你练习到目前为止学到的技巧。