Python绘制地图的利器—Cartopy
今天我们将学习 Cartopy, 它是在 python 中绘制地图的最常见的包之一。 一个受欢迎且功能强大的库是 Basemap。 Basemap 即将消失,并在不久的将来被 Cartopy 取代, 因此,建议您花时间来学习。
Cartopy 利用强大的PROJ.4,numpy和shapely库, 并包括基于Matplotlib构建的编程接口,用于创建出版质量地图。 cartopy 的主要特点是其面向对象的投影定义, 以及在这些投影之间转换点、线、向量、多边形和图像的能力。
Cartopy Projections 和其他参考系统
在 Cartopy 中,每个投影都是一个类。 尽管 Cartopy 对合理的默认设置持固执己见的立场, 但大多数类型的投影都能以特定于投影的方式进行配置, 以创建一个 Plate Carree 投影实例, 需要 cartopy 的 crs 模块。 这通常作为 ccrs(Cartopy 坐标参考系统)导入。
在导入绘制地图所需的模块之前, 首先要使用reticulate包在 Rstudio 中初始化 python 的链接, 并设置 seesion 获取 python 函数和包的环境, 须在 R 块中加载网状包并设置环境;
<pre> require(reticulate) </pre>
## Loading required package: reticulate
<pre> use_python("c:/Python/Anaconda3/") </pre>
利用import导入一些Python模块。 确保插入Pyhon块以加载这些模块。
import numpy as np
import pandas as pd
import cartopy.crs as ccrs
import cartopy
import matplotlib.pyplot as plt
使用下面的代码块访问Mollweide投影;
<pre> ccrs.Mollweide() </pre>
## <cartopy.crs.Mollweide object at 0x0000000028A475E8>
绘制地图
Cartopy可选地依赖于matplotlib, 每个投影都知道如何创建能够表示其自身的matplotlib Axes(或AxesSubploy)。
投影创建的轴是cartopy.mpl.Geoaxes.GeoAx。 Axes 子类覆盖了matplotlib的一些现有方法, 并添加了许多非常有用的方法来绘制地图。
稍后将很快返回并查看这些方法,但首先, 让我们看到cartopy+matplotlib 的实际效果:
<pre> import matplotlib.pyplot as plt
plt.axes(projection=ccrs.PlateCarree()) plt.show() </pre>
<center> </center>
令人印象深刻的是,创建的轴确实是GeoAx[SubPlot]实例之一。 在标准matplotlib axes类之上添加的最有用的方法之一是CoastLine方法。 在没有任何争议的情况下, 它将向地图中添加自然地球1:110000000比例尺的海岸线数据。
<pre> plt.figure() ax = plt.axes(projection=ccrs.PlateCarree()) ax.coastlines() plt.show() </pre>
<center>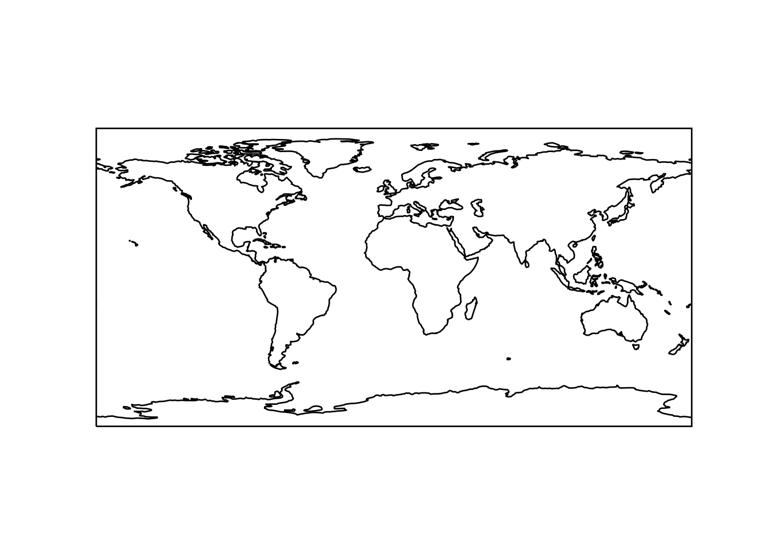 </center>
同样可以使用现有的许多方法之一创建 matplotlib 子图。 例如,可以使用 plt.subplots 函数:
<pre> fig, ax = plt.subplots(subplot_kw={'projection': ccrs.PlateCarree()}) ax.coastlines() plt.show </pre>
## <function make_python_function.<locals>.python_function at 0x0000000026489438>
投影类有一些选项可以用来自定义地图,以便非洲位于中心位置
<pre> ax = plt.axes(projection=ccrs.PlateCarree(central_longitude=0)) ax.coastlines() plt.show() </pre>
<center>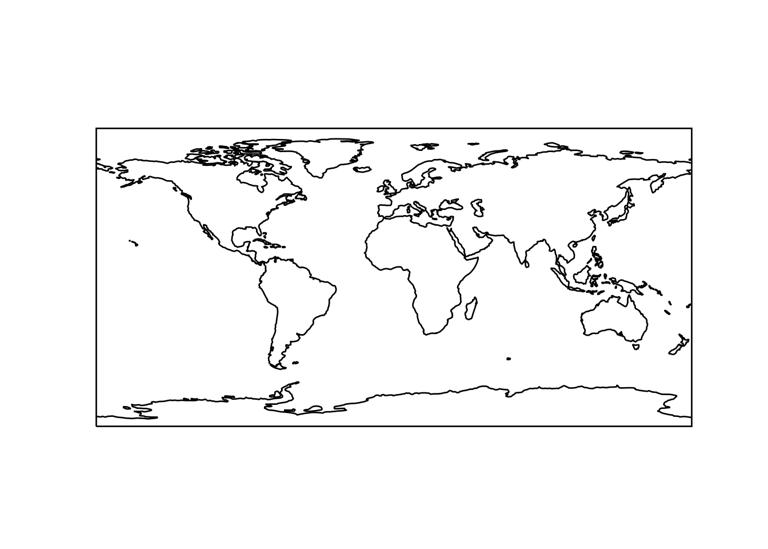 </center>
GeoAx的实用方法
Cartopy.mpl.Geoaxes.GeoAx类添加了许多有用的方法。 让我们来看一下:
Ⅰ. set_global -尽可能缩小地图
Ⅱ. set_extent -将地图缩放到给定的边界框
Ⅲ. gridlines -向轴添加经纬线(也可以添加标注)
Ⅳ. coastlines -将自然地球海岸线添加到轴线
Ⅴ. stock_img -将低分辨率的自然地球背景图像添加到轴
Ⅵ. imshow -将图像(NumPy数组)添加到轴
Ⅶ. add_geometries -将几何集合(形状)添加到轴
更多不同全球预测的示例
<pre> projections = [ccrs.PlateCarree(), ccrs.Robinson(), ccrs.Mercator(), ccrs.Orthographic(), ccrs.InterruptedGoodeHomolosine() ]
for proj in projections: plt.figure() ax = plt.axes(projection=proj) ax.stock_img() ax.coastlines() ax.set_title(f'{type(proj)}') plt.show() </pre>
<center>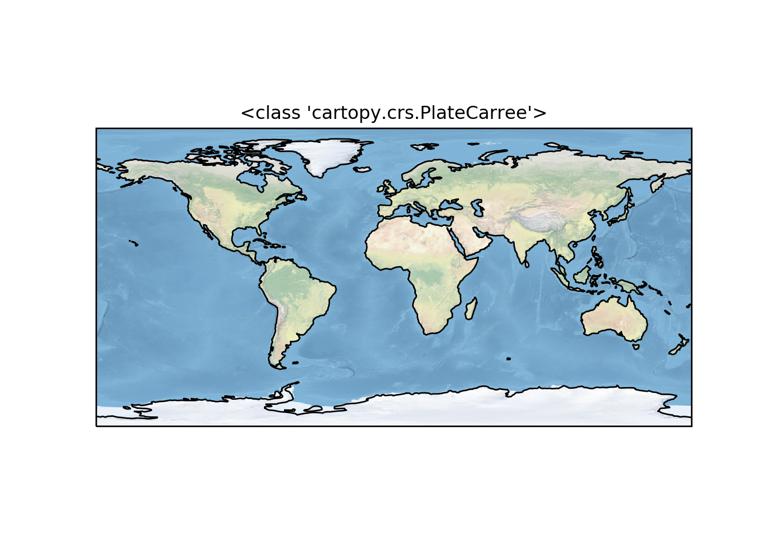 </center>
<center>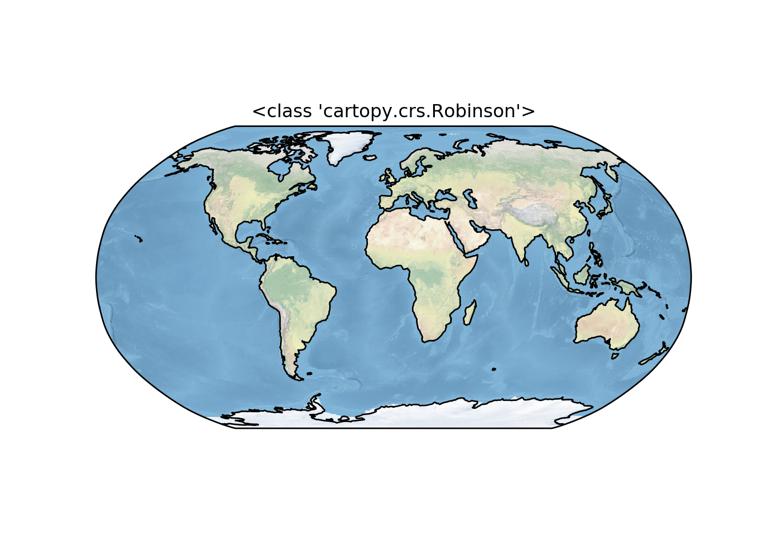 </center>
<center>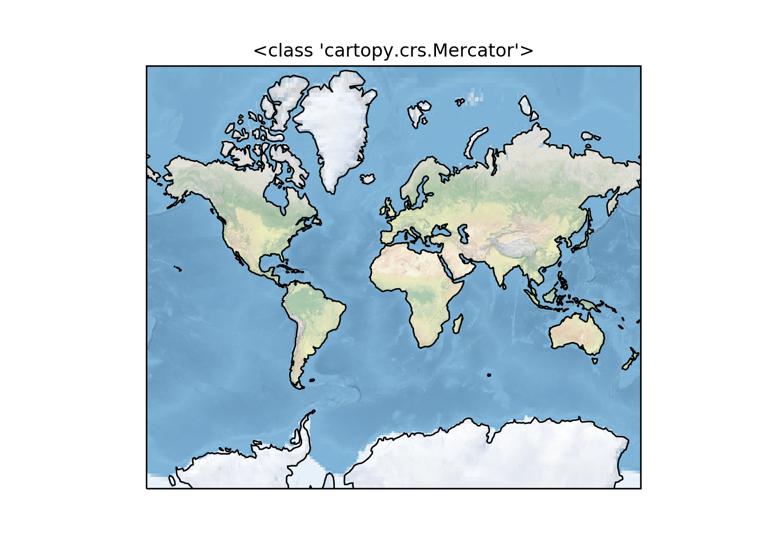 </center>
<center>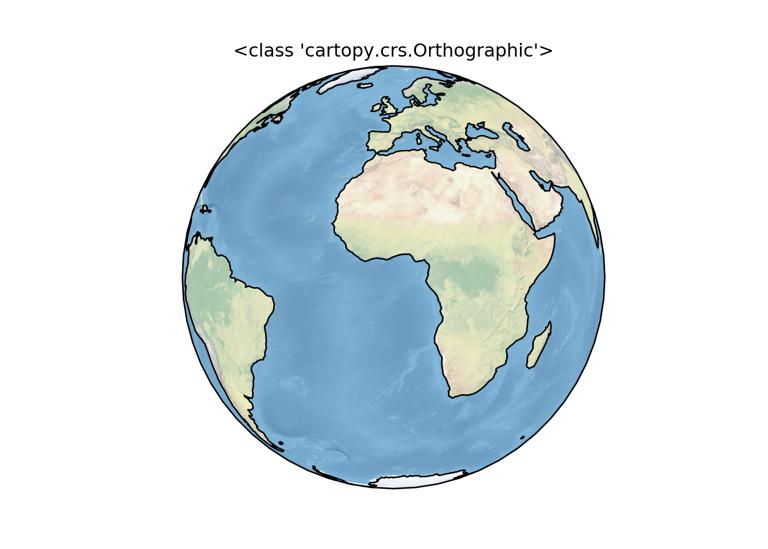 </center>
<center>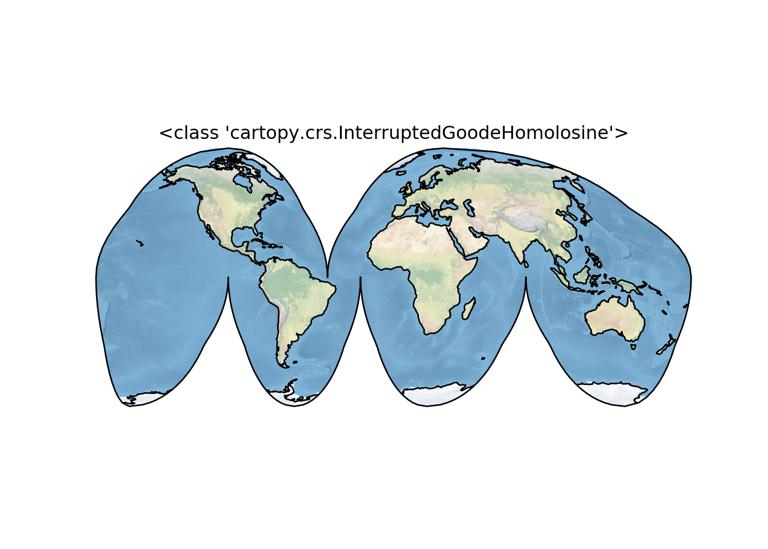 </center>
区域地图
为了创建区域地图,使用GeoAxis的Set_Extent方法来限制区域的大小。
<pre> central_lon =43, central_lat = -8.5 extent = [35, 50, -16.5, 0] ax = plt.axes(projection=ccrs.PlateCarree(central_lon, central_lat)) ax.set_extent(extent) ax.gridlines() ax.coastlines(resolution='50m') plt.show() </pre>
向地图添加要素
为了赋予地图更多的样式和细节,添加了cartopy.Feature对象。 内置了许多有用的功能。这些“默认功能”的分辨率粗略计为 (110米)。
Ⅰ. cartopy.feature.BORDERS 国家/地区边界
Ⅱ. cartopy.feature.COASTLINE 海岸线, 包括主要岛屿的 cartopy.feature.LAKES 天然和人工湖
Ⅲ. cartopy.feature.LAND 陆地多边形,包括主要岛屿
Ⅳ. cartopy.feature.OCEAN 海洋多边形
Ⅴ. cartopy.feature.RIVERS 单线排水系统,包括湖泊中心线
Ⅵ. cartopy.feature.STATES (这种规模仅限于美国)
<pre> import cartopy.feature as cfeature import numpy as np
central_lat = 37.5 central_lon = -96 extent = [28, 45, -25, 2] central_lon = np.mean(extent[:2]) central_lat = np.mean(extent[2:])
plt.figure(figsize=(6, 6)) ax = plt.axes(projection=ccrs.EquidistantConic(central_lon, central_lat)) ax.set_extent(extent)
ax.add_feature(cartopy.feature.OCEAN) ax.add_feature(cartopy.feature.LAND, edgecolor='black') ax.add_feature(cartopy.feature.LAKES, edgecolor='black') ax.add_feature(cartopy.feature.RIVERS) ax.gridlines() </pre>
## <cartopy.mpl.gridliner.Gridliner object at 0x000000003791BD88>
<pre> plt.show() </pre>
<center>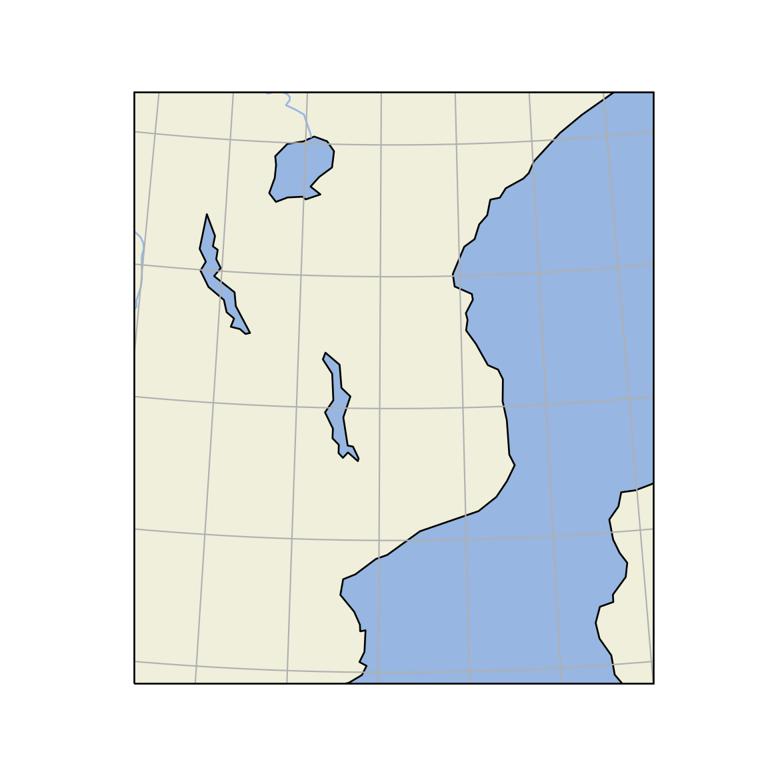 </center>
<pre> rivers_50m = cfeature.NaturalEarthFeature('physical', 'rivers_lake_centerlines', '10m')
central_lat = 37.5 central_lon = -96 extent = [28, 45, -25, 2] central_lon = np.mean(extent[:2]) central_lat = np.mean(extent[2:])
plt.figure(figsize=(6, 6)) ax = plt.axes(projection=ccrs.EquidistantConic(central_lon, central_lat)) ax.set_extent(extent)
ax.add_feature(cartopy.feature.OCEAN) ax.add_feature(cartopy.feature.LAND, edgecolor='black') ax.add_feature(cartopy.feature.LAKES, edgecolor='black') ax.add_feature(rivers_50m, facecolor='None', edgecolor='b') ax.gridlines() </pre>
## <cartopy.mpl.gridliner.Gridliner object at 0x0000000037A3F148>
<pre> plt.show() </pre>
<center>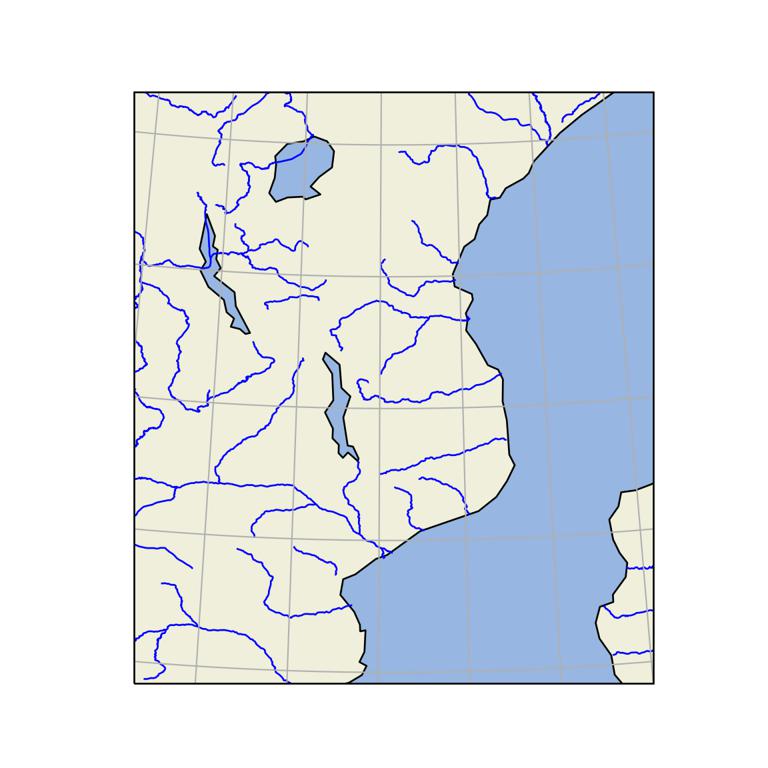 </center>
绘制二维(栅格)数据
同样的原则也适用于2D数据。 下面创建一些以正则经度/经度坐标定义的示例数据。 在本例中,我们将加载全球海洋表面温度数据。 数据以netcdf格式存储,因此需要加载:
<pre> import netCDF4 as nc </pre>
从netCDF4模块中调用一个数据集函数来读取文件
<pre> sst = nc.Dataset("e:/MatlabWorking/GHRSST/20150101.nc") </pre>
需要提取存储在文件中的不同变量。 但在提取之前,必须查看文件的内部结构, 并使用正确的名称标识变量。 可以使用nc.Variables函数来实现这一点
<pre> sst.variables </pre>
我们注意到该文件是lon. lat, analysed_sst, 和time. 时间是单个间隔。 提取变量,如下所示;
<pre> Time=sst.Variables[‘time’] LON=sst.Variables[‘lon’] Lat=sst.Variables[‘lat’] DATA=sst.Variables[‘Analysted_sst’] </pre>
由于数据在矩形网格中, 所以还需要使用 np.meshgrid() 将 lon 和 lat 转换为矩形网格。 meshgrid 的目的是从 x 值数组和 y 值数组创建一个矩形网格。
<pre> lon2d, lat2d = np.meshgrid(lon, lat) </pre>
因为温度是以开尔文标度记录的, 所以可以通过简单地减去 273 来简单地转换为度数
<pre> datar = data[0,:,:]-273
datar = np.flipud(datar)
</pre>
绘制全球海洋表面温度的空间分布图,如图1所示
<pre> plt.figure(figsize=(6,5)) ax = plt.axes(projection=ccrs.PlateCarree()) ax.set_global()
ax.set_extent([-170,170,-30,30])
ax.coastlines() ax.contourf(lon2d, lat2d, datar, cmap = "jet") </pre>
## <matplotlib.contour.QuadContourSet object at 0x0000000012567588>
<pre> ax.gridlines(draw_labels=True, xlocs=np.arange(-180,180,30)) </pre>
## <cartopy.mpl.gridliner.Gridliner object at 0x00000000125DDC48>
<pre> plt.show() </pre>
<center>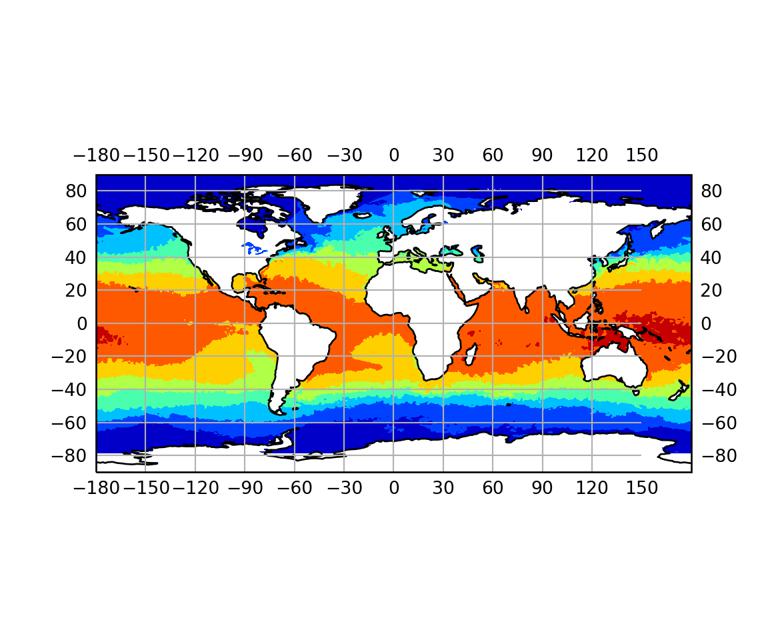 </center>
图1:海面温度
<pre> import numpy as np import matplotlib.pyplot as plt import cartopy.crs as ccrs import cartopy.feature as cfeature from matplotlib.offsetbox import AnchoredText
fig = plt.figure()
ax = fig.add_subplot(1, 1, 1, projection=ccrs.PlateCarree())
ax = plt.axes(projection=ccrs.PlateCarree()) ax.set_extent([80, 170, -45, 30], crs=ccrs.PlateCarree())
Put a background image on for nice sea rendering.
ax.stock_img()
Create a feature for States/Admin 1 regions at 1:50m from Natural Earth
states_provinces = cfeature.NaturalEarthFeature( category='cultural', name='admin_1_states_provinces_lines', scale='50m', facecolor='none')
SOURCE = 'Natural Earth' LICENSE = 'public domain'
ax.add_feature(cfeature.LAND) ax.add_feature(cfeature.COASTLINE) ax.add_feature(states_provinces, edgecolor='gray')
Add a text annotation for the license information to the
the bottom right corner.
text = AnchoredText(r'$\mathcircled{{c}}$ {}; license: {}' ''.format(SOURCE, LICENSE), loc=4, prop={'size': 12}, frameon=True) ax.add_artist(text) plt.show() </pre>
<center>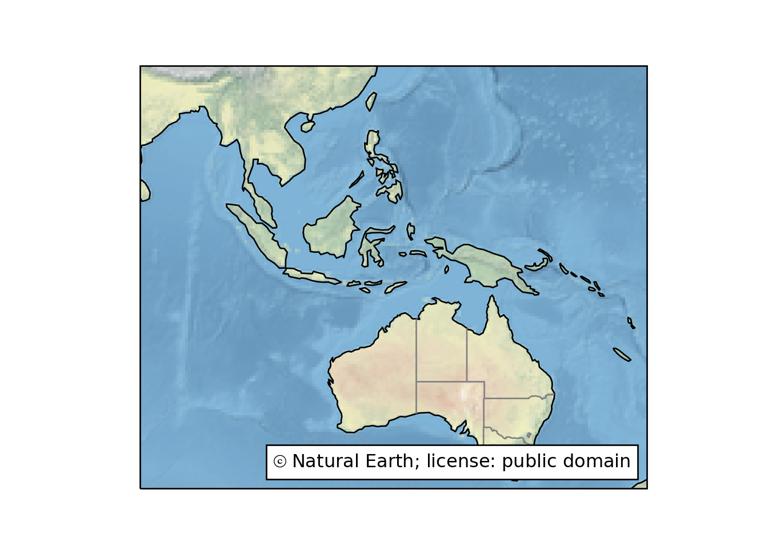 </center>
<pre> fig = plt.figure() ax = plt.axes(projection=ccrs.PlateCarree()) ax.set_extent([20, 70, -40, 20], crs=ccrs.PlateCarree()) ax.add_feature(cfeature.LAND, edgecolor='gray') ax.add_feature(cfeature.BORDERS) ax.add_feature(cfeature.COASTLINE) ax.gridlines(xlocs=np.arange(20,70,10), draw_labels=True, crs=ccrs.PlateCarree()) </pre>
## <cartopy.mpl.gridliner.Gridliner object at 0x0000000037A54748>
<pre> plt.show() </pre>
<center>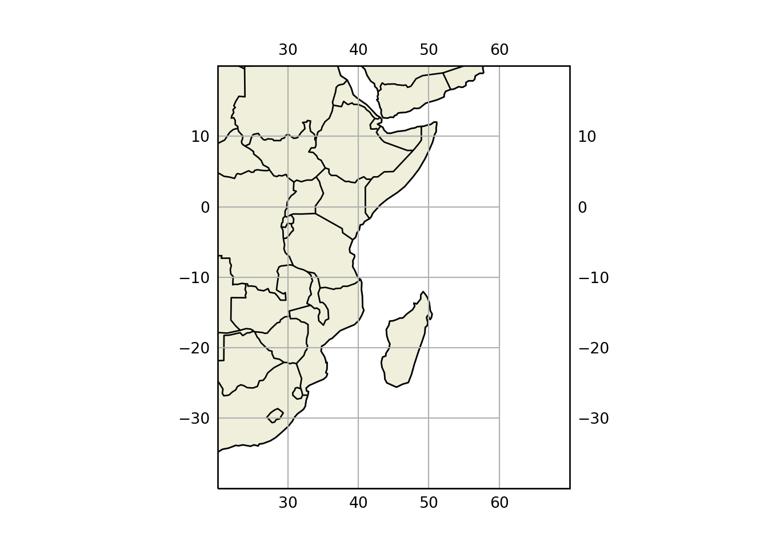 </center>
<pre> fig = plt.figure() ax = plt.axes(projection=ccrs.PlateCarree()) ax.set_extent([20, 70, -40, 20], crs=ccrs.PlateCarree())
Put a background image on for nice sea rendering.
ax.stock_img() ax.add_feature(cfeature.BORDERS) ax.add_feature(cfeature.COASTLINE) ax.gridlines(xlocs=np.arange(20,70,10), draw_labels=True, crs=ccrs.PlateCarree()) </pre>
## <cartopy.mpl.gridliner.Gridliner object at 0x000000003815EC08>
<pre> plt.show() </pre>
<center>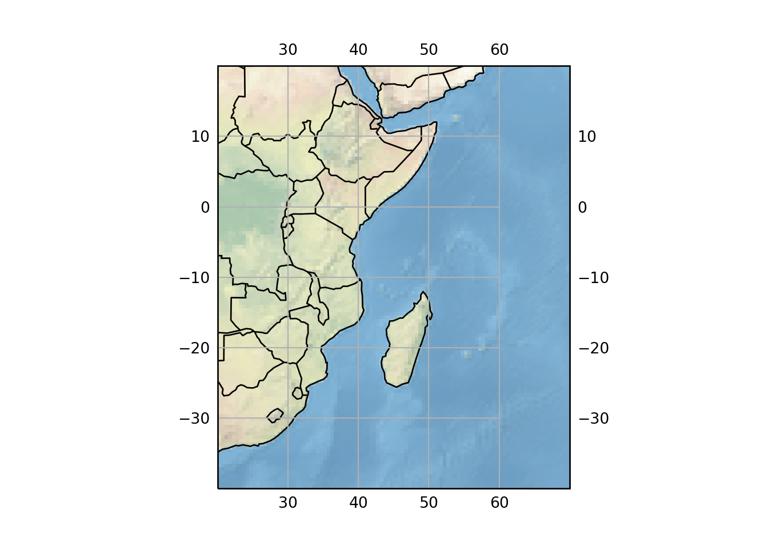 </center>
<pre> fig = plt.figure() ax = fig.add_subplot(1, 1, 1, projection=ccrs.PlateCarree()) ax.set_extent([-20, 60, -40, 45], crs=ccrs.PlateCarree()) ax.stock_img() ax.add_feature(cfeature.LAND) ax.add_feature(cfeature.OCEAN) ax.add_feature(cfeature.COASTLINE) ax.add_feature(cfeature.BORDERS, linestyle='dotted') ax.add_feature(cfeature.LAKES, alpha=0.5) ax.add_feature(cfeature.RIVERS) plt.show() </pre>
<center>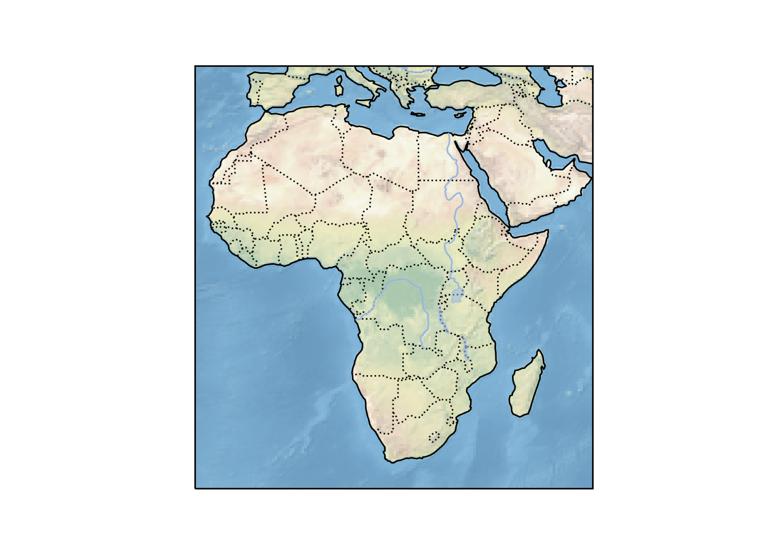 </center>
全球地图
一个简单地图的示例, 用于比较两个位置之间的 Geodetic 和 Plate Carree 线。
<pre> fig = plt.figure(figsize=(8, 4)) ax = fig.add_subplot(1, 1, 1, projection=ccrs.Robinson(central_longitude=0)) ax.set_global() ax.stock_img() ax.coastlines() ax.gridlines()
ax.plot(-0.08, 51.53, 'o', transform=ccrs.PlateCarree())
ax.plot([-0.08, 132], [51.53, 43.17], transform=ccrs.PlateCarree())
ax.plot([-0.08, 132], [51.53, 43.17], transform=ccrs.Geodetic())
</pre>
## <cartopy.mpl.gridliner.Gridliner object at 0x000000003BD9A748>
<pre> plt.show() </pre>
<center>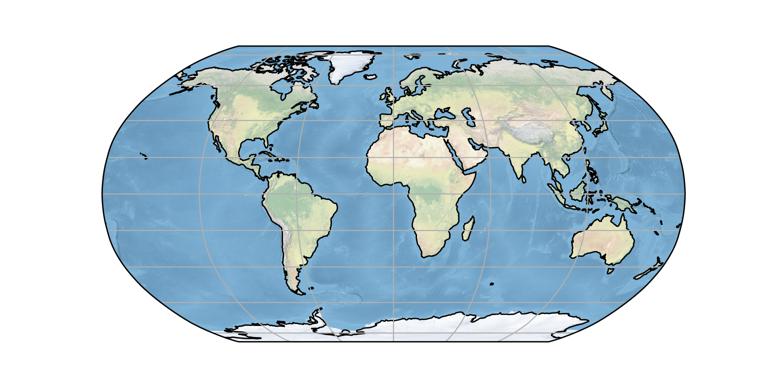 </center>
填充轮廓
使用网格海洋表面温度,因为想看到太平洋和印度洋, 所以使用了Mollweide投影,并将经度居中到130。
<pre>
read the netcdf file with Dataset function from netCDF4 module
sst = nc.Dataset("e:/MatlabWorking/GHRSST/20050101.nc")
sst.variables
extract individual varibales in the nc file
time = sst.variables['time'][:] lon = sst.variables['lon'][:] lat = sst.variables['lat'][:] sst = sst.variables['analysed_sst']
extract an array of the first day and convert temperature from Kelvin to Degree Celsius
sstr = sst[0,:,:]-273
create a rectangular of the long and lat
lon2d, lat2d = np.meshgrid(lon, lat)
plt.figure(figsize=(8,4)) ax = plt.axes(projection=ccrs.Mollweide(central_longitude=160),) ax.set_global()
ax.set_extent([-170,170,-30,30])
ax.coastlines() ax.contourf(lon2d, lat2d, datar, transform=ccrs.PlateCarree(), cmap='nipy_spectral')
ax.gridlines(draw_labels=True, xlocs=np.arange(-180,180,30))# unsupported with Mollweide
</pre>
## <matplotlib.contour.QuadContourSet object at 0x000000003BDEB308>
<pre> plt.show() </pre>
<center>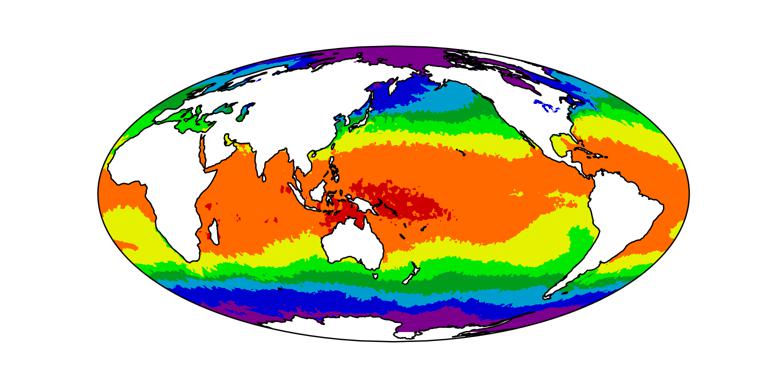 </center>
读取和绘制平均海平面异常图,如下图所示
<pre>
read mean sea level anomaly data
msla = nc.Dataset("e:/MatlabWorking/Altimetry/msla_h/indian_ocean-twosat-msla-h_010193_311295.nc")
msla.variables
time = msla.variables['time'][:] lon = msla.variables['lon'][:] lat = msla.variables['lat'][:] sla = msla.variables['sla'] sla30 = sla[30,:,:]
lon2d, lat2d = np.meshgrid(lon, lat)
plt.figure(figsize=(6,5)) ax = plt.axes(projection=ccrs.Mollweide(central_longitude=60))
ax.set_global()
ax.set_extent([20,120,-50,20]) ax.coastlines()
ax.add_feature(cfeature.BORDERS, linestyle = "dotted") # uncomment to plot country boundaries
ax.contourf(lon2d, lat2d, sla30, transform=ccrs.PlateCarree(), cmap='nipy_spectral') </pre>
## <matplotlib.contour.QuadContourSet object at 0x0000000037A6D548>
<pre> ax.gridlines(draw_labels=False, xlocs=np.arange(-180,180,30)) </pre>
## <cartopy.mpl.gridliner.Gridliner object at 0x00000000349F7908>
<pre> plt.show() </pre>
<center>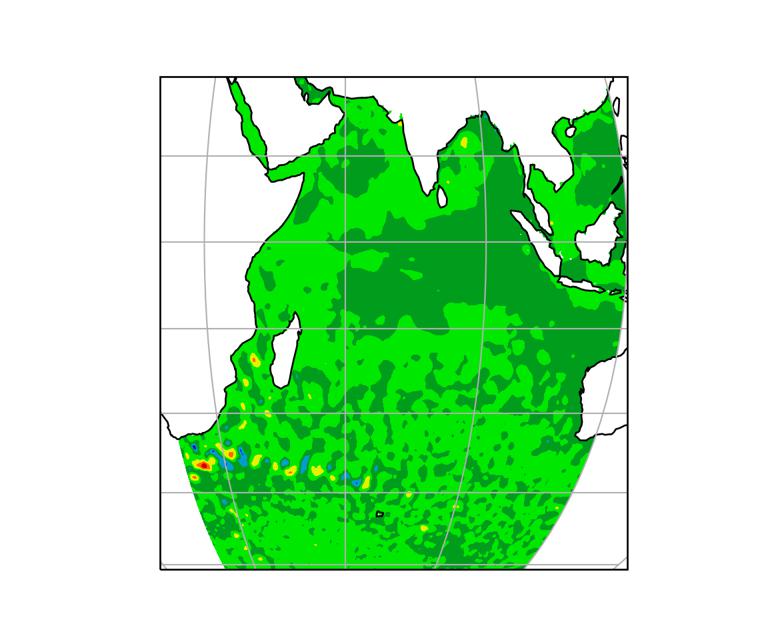 </center>
本文链接 :Python绘制地图的利器—Cartopy