注解
Click here 下载完整的示例代码
自定义颜色条教程
本教程将介绍如何构建和自定义独立的色条,即不使用附加的绘图。
自定义颜色条
A colorbar 需要一个“可映射的” (matplotlib.cm.ScalarMappable )对象(通常是图像),指示要使用的颜色贴图和规范。用ColorAn来创建一个没有附加的图像 ScalarMappable 没有关联的数据。
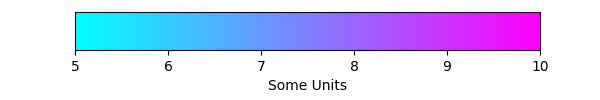
基本连续颜色条
这里我们创建了一个基本的连续色条,其中有记号和标签。
关于 colorbar 呼叫是 ScalarMappable (使用 norm 和 cmap 参数)、应绘制colorbar的轴以及colorbar的方向。
有关更多信息,请参阅 colorbar 应用程序编程接口。
import matplotlib.pyplot as plt
import matplotlib as mpl

fig, ax = plt.subplots(figsize=(6, 1))
fig.subplots_adjust(bottom=0.5)

cmap = mpl.cm.cool
norm = mpl.colors.Normalize(vmin=5, vmax=10)

fig.colorbar(mpl.cm.ScalarMappable(norm=norm, cmap=cmap),
             cax=ax, orientation='horizontal', label='Some Units')
出:
<matplotlib.colorbar.Colorbar object at 0x7fa9bcddae48>
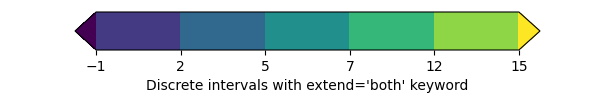
具有连续色阶的扩展色条
第二个示例演示如何基于连续cmap生成离散色条。要用关键字“colorspace”填充相应的颜色扩展,请选择:
fig, ax = plt.subplots(figsize=(6, 1))
fig.subplots_adjust(bottom=0.5)

cmap = mpl.cm.viridis
bounds = [-1, 2, 5, 7, 12, 15]
norm = mpl.colors.BoundaryNorm(bounds, cmap.N, extend='both')
cb2 = mpl.colorbar.ColorbarBase(ax, cmap=cmap,
                                norm=norm,
                                orientation='horizontal')
cb2.set_label("Discrete intervals with extend='both' keyword")
fig.show()
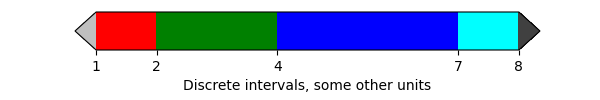
离散间隔颜色条
第三个例子说明了 ListedColormap 从一组列出的颜色生成颜色映射, colors.BoundaryNorm 它基于离散的间隔和扩展的端点生成一个颜色映射索引,以显示“过”和“欠”值颜色。over和under用于显示规范化之外的数据 [0, 1] 范围。在这里,我们将颜色作为灰色阴影传递,作为编码0-1范围内的浮点的字符串。
如果A ListedColormap 如果使用,则边界数组的长度必须大于颜色列表的长度。边界必须单调递增。
这一次,我们将其他参数传递给 colorbar . 用于在颜色栏上显示超出范围的值而不使用 延伸 关键字与 colors.BoundaryNorm ,我们必须使用 延伸 关键字参数,并在范围的每一端提供一个附加边界。这里我们还使用spacing参数使每个colorbar段的长度与其相应的间隔成比例。
fig, ax = plt.subplots(figsize=(6, 1))
fig.subplots_adjust(bottom=0.5)

cmap = mpl.colors.ListedColormap(['red', 'green', 'blue', 'cyan'])
cmap.set_over('0.25')
cmap.set_under('0.75')

bounds = [1, 2, 4, 7, 8]
norm = mpl.colors.BoundaryNorm(bounds, cmap.N)
fig.colorbar(
    mpl.cm.ScalarMappable(cmap=cmap, norm=norm),
    cax=ax,
    boundaries=[0] + bounds + [13],  # Adding values for extensions.
    extend='both',
    ticks=bounds,
    spacing='proportional',
    orientation='horizontal',
    label='Discrete intervals, some other units',
)
出:
<matplotlib.colorbar.Colorbar object at 0x7fa9e4e4cd30>
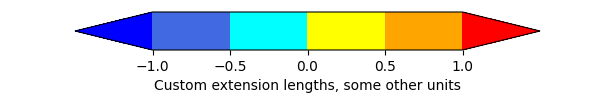
带自定义扩展长度的颜色条
在这里,我们演示了在具有离散间隔的颜色栏上使用自定义长度的颜色栏扩展。要使每个延伸部分的长度与内部颜色的长度相同,请使用 extendfrac='auto' .
fig, ax = plt.subplots(figsize=(6, 1))
fig.subplots_adjust(bottom=0.5)

cmap = mpl.colors.ListedColormap(['royalblue', 'cyan',
                                  'yellow', 'orange'])
cmap.set_over('red')
cmap.set_under('blue')

bounds = [-1.0, -0.5, 0.0, 0.5, 1.0]
norm = mpl.colors.BoundaryNorm(bounds, cmap.N)
fig.colorbar(
    mpl.cm.ScalarMappable(cmap=cmap, norm=norm),
    cax=ax,
    boundaries=[-10] + bounds + [10],
    extend='both',
    extendfrac='auto',
    ticks=bounds,
    spacing='uniform',
    orientation='horizontal',
    label='Custom extension lengths, some other units',
)

plt.show()
关键词:matplotlib代码示例,codex,python plot,pyplot Gallery generated by Sphinx-Gallery