10.1. Suricata.yaml
Suricata使用yaml格式进行配置。源代码中包含的suricata.yaml文件是suricata的示例配置。本文档将解释每个选项。
在yaml文件的顶部可以找到%yaml 1.1。Suricata读取文件并将文件标识为yaml。
10.1.1. 最大挂起数据包数
通过最大挂起数据包设置,您可以设置允许Suricata同时处理的数据包数量。这可以从一个包到数万个/数十万个包。这是一种高性能和使用更多内存(RAM)或更低性能和更少内存使用的交易。处理的大量数据包会导致更高的性能和更多的内存使用。数据包数量少,导致性能降低和内存使用减少。选择处理的数据包数量较少,同时具有多个CPU/CPU核心,可能导致无法利用整个计算机容量。(例如:在有三个等待处理数据包时使用一个内核。)
max-pending-packets: 1024
10.1.2. 运行模式
默认情况下,运行模式选项被禁用,运行模式设置可以设置要使用的运行模式。对于所有可用的运行模式,输入 --list-runmodes 在命令行中。有关详细信息,请参阅 运行模式 .
runmode: autofp
10.1.3. 默认数据包大小
对于max pending packets选项,suricata必须将数据包保存在内存中。使用默认数据包大小选项,可以设置网络上数据包的大小。有时可能需要处理较大的数据包。引擎仍然可以处理这些较大的包,但是处理它会降低性能。
default-packet-size: 1514
10.1.4. 用户和组
可以将用户和组设置为运行suricata:
run-as:
  user: suri
  group: suri
10.1.5. PID文件
当以守护程序模式运行suricata时,此选项设置pid文件的名称。此文件记录Suricata进程ID。
pid-file: /var/run/suricata.pid
注解
此配置文件选项仅在以守护程序模式运行时设置PID文件。要在不以守护程序模式运行时强制创建PID文件,请使用 --pidfile 命令行选项。
此外,如果运行多个Suricata进程,则每个进程都需要指定不同的PID文件位置。
10.1.6. 行动令
所有签名都有不同的属性。其中之一是动作属性。这个决定了签名匹配时将发生什么。有四种类型的动作。当签名匹配并包含以下操作之一时将发生的情况的摘要:
通过
如果签名匹配并且包含pass,则Suricata将停止扫描数据包并跳到所有规则的末尾(仅针对当前数据包)。
跌落
这只涉及ips/inline模式。如果程序找到一个匹配的签名(包含drop),它将立即停止。数据包将不再发送。缺点:接收器没有收到正在发生的事情的消息,导致超时(当然是TCP)。Suricata为此数据包生成警报。
拒绝
这是对数据包的主动拒绝。接收端和发送端都接收到拒绝数据包。有两种类型的拒绝数据包将被自动选择。如果有问题的数据包与TCP有关,它将是一个重置数据包。对于所有其他协议,它将是一个ICMP错误包。Suricata也会生成警报。当处于inline/ips模式时,违规数据包也将像“drop”操作一样被删除。
警觉的
如果签名匹配并包含警报,则该包将被视为任何其他非威胁包,但此包除外,将通过Suricata生成警报。只有系统管理员才能注意到此警报。
内联/ips可以通过两种方式阻止网络流量。一种方法是直接丢弃,另一种方法是拒绝。
规则将按它们在文件中显示的顺序加载。但它们将以不同的顺序进行处理。签名具有不同的优先级。最重要的签名将首先被扫描。有可能改变优先顺序。默认顺序为:通过、删除、拒绝、警告。
action-order:
 - pass
 - drop
 - reject
 - alert
这意味着在删除规则之前考虑通过规则,在拒绝规则之前考虑删除规则,等等。
10.1.7. 在多个文件中拆分配置
有些用户可能需要或希望将他们的suricata.yaml文件拆分为单独的文件,这对于“include”和“”是可用的!include'关键字。第一个例子是获取输出部分的内容并将其存储在outputs.yaml中。
# outputs.yaml
- fast
    enabled: yes
    filename: fast.log
    append: yes

...
# suricata.yaml
...

outputs: !include outputs.yaml

...
第二种方案是将多个部分迁移到不同的yaml文件。
# host_1.yaml

max-pending-packets: 2048

outputs:
    - fast
        enabled: yes
        filename: fast.log
        append: yes
# suricata.yaml

include: host_1.yaml

...
如果相同的部分say输出在include语句之后被重新定义,它将覆盖包含的文件。因此,文档末尾的任何include语句都将覆盖已经配置的部分。
10.1.8. 事件输出
10.1.8.1. 默认日志记录目录
在/var/log/suricata目录中,将存储suricata的所有输出(警报和事件)。
default-log-dir: /var/log/suricata
可以通过输入-l命令行参数或直接在yaml中更改目录来覆盖此目录。要使用-l命令行参数更改它,请输入以下内容:
suricata -c suricata.yaml -i eth0 -l /var/log/suricata-logs/
10.1.8.2. 统计
引擎统计信息,如包计数器、内存使用计数器和其他统计信息,可以通过多种方式进行记录。默认情况下,会启用单独的文本日志“stats.log”和EVE记录类型“stats”。
这些状态具有全局配置和每个记录器配置。这里记录了全局配置。
# global stats configuration
stats:
  enabled: yes
  # The interval field (in seconds) controls at what interval
  # the loggers are invoked.
  interval: 8
  # Add decode events as stats.
  #decoder-events: true
  # Decoder event prefix in stats. Has been 'decoder' before, but that leads
  # to missing events in the eve.stats records. See issue #2225.
  #decoder-events-prefix: "decoder.event"
  # Add stream events as stats.
  #stream-events: false
统计数据可以是 enabled 或者这里残疾。
统计数据转储到 interval .由于线程是如何在内部同步的,因此将其设置为3或4秒以下并不有用。
解码层生成的解码器事件可以根据事件类型创建计数器。默认情况下会启用此行为。这个 decoder-events 选项可以设置为 false 禁用。
在4.1.x中,常规解码器计数器和解码器事件计数器之间存在命名冲突。这会导致大量解码器事件计数器未显示在夏娃统计记录。为了解决这个问题而不破坏现有的设置,一个配置选项 decoder-events-prefix was added to change the naming of the decoder-events from decoder.<proto>.<event> to decoder.event.<proto>.<event>. In 5.0 this became the default. See issue 2225 .
类似于 decoder-events 选项,即 stream-events 选项控制流事件是否也作为计数器添加。这在默认情况下是禁用的。
10.1.8.3. 输出
有几种类型的输出。总体结构为:
outputs:
  - fast:
    enabled: yes
    filename: fast.log
    append: yes/no
启用所有日志,将导致性能降低,并使用更多的磁盘空间,因此只启用所需的输出。
10.1.8.4. 基于行的警报日志(fast.log)
此日志包含由一行组成的警报。单个fast.log文件行的外观示例:
10/05/10-10:08:59.667372  [**] [1:2009187:4] ET WEB_CLIENT ACTIVEX iDefense
  COMRaider ActiveX Control Arbitrary File Deletion [**] [Classification: Web
  Application Attack] [Priority: 3] {TCP} xx.xx.232.144:80 -> 192.168.1.4:56068
-fast:                    #The log-name.
   enabled:yes            #This log is enabled. Set to 'no' to disable.
   filename: fast.log     #The name of the file in the default logging directory.
   append: yes/no         #If this option is set to yes, the last filled fast.log-file will not be
                          #overwritten while restarting Suricata.
10.1.8.5. EVE(可扩展事件格式)
这是警报和事件的JSON输出。它允许与第三方工具(如logstash)轻松集成。
outputs:
  # Extensible Event Format (nicknamed EVE) event log in JSON format
  - eve-log:
      enabled: yes
      filetype: regular #regular|syslog|unix_dgram|unix_stream|redis
      filename: eve.json
      # Enable for multi-threaded eve.json output; output files are amended
      # with an identifier, e.g., eve.9.json
      #threaded: false
      #prefix: "@cee: " # prefix to prepend to each log entry
      # the following are valid when type: syslog above
      #identity: "suricata"
      #facility: local5
      #level: Info ## possible levels: Emergency, Alert, Critical,
                   ## Error, Warning, Notice, Info, Debug
      #redis:
      #  server: 127.0.0.1
      #  port: 6379
      #  async: true ## if redis replies are read asynchronously
      #  mode: list ## possible values: list|lpush (default), rpush, channel|publish
      #             ## lpush and rpush are using a Redis list. "list" is an alias for lpush
      #             ## publish is using a Redis channel. "channel" is an alias for publish
      #  key: suricata ## key or channel to use (default to suricata)
      # Redis pipelining set up. This will enable to only do a query every
      # 'batch-size' events. This should lower the latency induced by network
      # connection at the cost of some memory. There is no flushing implemented
      # so this setting as to be reserved to high traffic suricata.
      #  pipelining:
      #    enabled: yes ## set enable to yes to enable query pipelining
      #    batch-size: 10 ## number of entry to keep in buffer

      # Include top level metadata. Default yes.
      #metadata: no

      types:
        - alert:
            # payload: yes             # enable dumping payload in Base64
            # payload-buffer-size: 4kb # max size of payload buffer to output in eve-log
            # payload-printable: yes   # enable dumping payload in printable (lossy) format
            # packet: yes              # enable dumping of packet (without stream segments)
            # http-body: yes           # Requires metadata; enable dumping of http body in Base64
            # http-body-printable: yes # Requires metadata; enable dumping of http body in printable format

            # Enable the logging of tagged packets for rules using the
            # "tag" keyword.
            tagged-packets: yes

            # Configure the metadata to be logged along with an
            # alert. The following shows the default configuration
            # which is used if this field is not provided or simply
            # set to a truthful value. Setting of this section is only
            # required if you wish to enable/disable specific fields.
            #metadata:

              # Include the decoded application layer (ie. http, dns)
              app-layer: true

              # Log the the current state of the flow record.
              flow: true

              rule:
                # Log the metadata field from the rule in a structured
                # format.
                metadata: true

                # Log the raw rule text.
                raw: false

            # HTTP X-Forwarded-For support by adding an extra field or overwriting
            # the source or destination IP address (depending on flow direction)
            # with the one reported in the X-Forwarded-For HTTP header. This is
            # helpful when reviewing alerts for traffic that is being reverse
            # or forward proxied.
            xff:
              enabled: no
              # Two operation modes are available, "extra-data" and "overwrite".
              mode: extra-data
              # Two proxy deployments are supported, "reverse" and "forward". In
              # a "reverse" deployment the IP address used is the last one, in a
              # "forward" deployment the first IP address is used.
              deployment: reverse
              # Header name where the actual IP address will be reported, if more
              # than one IP address is present, the last IP address will be the
              # one taken into consideration.
              header: X-Forwarded-For
        - http:
            extended: yes     # enable this for extended logging information
            # custom allows additional http fields to be included in eve-log
            # the example below adds three additional fields when uncommented
            #custom: [Accept-Encoding, Accept-Language, Authorization]
        - dns:
            # Use version 2 logging with the new format:
            # dns answers will be logged in one single event
            # rather than an event for each of the answers.
            # Without setting a version the version
            # will fallback to 1 for backwards compatibility.
            version: 2

            # Enable/disable this logger. Default: enabled.
            #enabled: no

            # Control logging of requests and responses:
            # - requests: enable logging of DNS queries
            # - responses: enable logging of DNS answers
            # By default both requests and responses are logged.
            #requests: no
            #responses: no

            # Format of answer logging:
            # - detailed: array item per answer
            # - grouped: answers aggregated by type
            # Default: all
            #answer-format: [detailed, grouped]

            # Answer types to log.
            # Default: all
            #answer-types: [a, aaaa, cname, mx, ns, ptr, txt]
        - dns:
            # Version 1 DNS logger.
            # Deprecated: Will be removed by May 2022.
            version: 1

            enabled: no
            # control logging of queries and answers
            # default yes, no to disable
            query: yes     # enable logging of DNS queries
            answer: yes    # enable logging of DNS answers
            # control which RR types are logged
            # all enabled if custom not specified
            #custom: [a, aaaa, cname, mx, ns, ptr, txt]
        - tls:
            extended: yes     # enable this for extended logging information
            # output TLS transaction where the session is resumed using a
            # session id
            #session-resumption: no
            # custom allows to control which tls fields that are included
            # in eve-log
            #custom: [subject, issuer, session_resumed, serial, fingerprint, sni, version, not_before, not_after, certificate, chain]
        - files:
            force-magic: no   # force logging magic on all logged files
            # force logging of checksums, available hash functions are md5,
            # sha1 and sha256
            #force-hash: [md5]
        #- drop:
        #    alerts: yes      # log alerts that caused drops
        #    flows: all       # start or all: 'start' logs only a single drop
        #                     # per flow direction. All logs each dropped pkt.
        - smtp:
            #extended: yes # enable this for extended logging information
            # this includes: bcc, message-id, subject, x_mailer, user-agent
            # custom fields logging from the list:
            #  reply-to, bcc, message-id, subject, x-mailer, user-agent, received,
            #  x-originating-ip, in-reply-to, references, importance, priority,
            #  sensitivity, organization, content-md5, date
            #custom: [received, x-mailer, x-originating-ip, relays, reply-to, bcc]
            # output md5 of fields: body, subject
            # for the body you need to set app-layer.protocols.smtp.mime.body-md5
            # to yes
            #md5: [body, subject]

        # NFS logging. Requires Rust.
        - nfs
        # IKE logging. Requires Rust.
        - ike
        - ssh
        - stats:
            totals: yes       # stats for all threads merged together
            threads: no       # per thread stats
            deltas: no        # include delta values
        - dhcp:
            # DHCP logging requires Rust.
            enabled: yes
            # When extended mode is on, all DHCP messages are logged
            # with full detail. When extended mode is off (the
            # default), just enough information to map a MAC address
            # to an IP address is logged.
            extended: no
        # bi-directional flows
        - flow
        # uni-directional flows
        #- netflow

        # An event for logging metadata, specifically pktvars when
        # they are set, but will also include the full metadata object.
        #- metadata
有关更高级的配置选项,请参阅 Eve JSON Output .
格式记录在 Eve JSON Format .
10.1.8.6. 基于行的HTTP请求日志(http.log)
此日志跟踪所有HTTP流量事件。它包含HTTP请求、主机名、URI和用户代理。此信息将存储在http.log中(默认名称,在suricata日志目录中)。也可以通过使用 Eve-log capability .
具有非扩展日志记录的HTTP日志行示例:
07/01/2014-04:20:14.338309 vg.no [**] / [**] Mozilla/5.0 (Macintosh; Intel Mac OS X 10_9_2)
AppleWebKit/537.36 (KHTML, like Gecko) Chrome/35.0.1916.114 Safari/537.36 [**]
192.168.1.6:64685 -> 195.88.54.16:80
扩展日志记录的HTTP日志行示例:
07/01/2014-04:21:06.994705 vg.no [**] / [**] Mozilla/5.0 (Macintosh; Intel Mac OS X 10_9_2)
AppleWebKit/537.36 (KHTML, like Gecko) Chrome/35.0.1916.114 Safari/537.36 [**] <no referer> [**]
GET [**] HTTP/1.1 [**] 301 => http://www.vg.no/ [**] 239 bytes [**] 192.168.1.6:64726 -> 195.88.54.16:80
- http-log:                     #The log-name.
    enabled: yes                #This log is enabled. Set 'no' to disable.
    filename: http.log          #The name of the file in the default logging directory.
    append: yes/no              #If this option is set to yes, the last filled http.log-file will not be
                                # overwritten while restarting Suricata.
    extended: yes               # If set to yes more information is written about the event.
10.1.8.7. 数据包日志(PCAP日志)
使用PCAP日志选项,您可以将通过Suricata注册的所有数据包保存在名为 _log.pcap_. 这样,您可以随时查看所有数据包。在正常模式下,PCAP文件在默认日志目录中创建。如果在yaml文件中设置了绝对路径,也可以在其他地方创建它。
保存在示例-log dir/var/log/suricata中的文件可以用支持PCAP文件格式的每个程序打开。这可以是wireshark、tcpdump、suricata、snort和许多其他。
可以启用和禁用PCAP日志选项。
可以设置PCAP日志文件的大小限制。默认限制为32 MB。如果日志文件达到此限制,将旋转该文件并创建一个新文件。PCAP日志选项具有“sguil”的额外功能:http://sguil.sourceforge.net/,可以在“模式”选项中启用。在sguil模式中,“sguil_base_dir”表示基本目录。在此基目录中,PCAP是在基于日期的sguil特定目录结构中创建的:
$sguil_base_dir/YYYY-MM-DD/$filename.<timestamp>
如果要将suricata与sguil一起使用,请不要忘记在suricata.yaml文件中启用(以及在必要时修改)基目录。请记住,在“正常”模式下,文件将保存在默认日志目录或绝对路径中(如果设置)。
PCAP文件可以在写入磁盘之前通过将压缩选项设置为LZ4进行压缩。此选项与sguil模式不兼容。注意:在Windows上,此选项增加磁盘I/O而不是减少磁盘I/O。使用LZ4压缩时,可以使用LZ4校验和选项启用校验和,并且可以将压缩级别LZ4级别设置为介于0和16之间的值,较高级别会导致更高的压缩。
默认情况下,所有数据包都会被记录,除了:
TCP流超出stream.reassembly.depth
密钥交换后加密的流
- pcap-log:
    enabled:  yes
    filename: log.pcap

    # Limit in MB.
    limit: 32

    mode: sguil # "normal" (default) or sguil.
    sguil_base_dir: /nsm_data/
10.1.8.8. 详细警报日志(alert debug.log)
这是一种日志类型,提供有关警报的补充信息。这对于那些调查假阳性和写签名的人来说特别方便。但是,由于必须存储的信息量太大,它会降低性能。
- alert-debug:                  #The log-name.
    enabled: no                 #This log is not enabled. Set 'yes' to enable.
    filename: alert-debug.log   #The name of the file in the default logging directory.
    append: yes/no              #If this option is set to yes, the last filled fast.log-file will not be
                                # overwritten while restarting Suricata.
10.1.8.9. 统计
在stats中,您可以设置stats.log的选项。当启用stats.log时,您可以设置将输出数据写入日志文件的时间(以秒为单位)。
- stats:
     enabled: yes               #By default, the stats-option is enabled
     filename: stats.log        #The log-name. Combined with the default logging directory
                                #(default-log-dir) it will result in /var/log/suricata/stats.log.
                                #This directory can be overruled with a absolute path. (A
                                #directory starting with / ).
     append: yes/no             #If this option is set to yes, the last filled fast.log-file will not be
                                #overwritten while restarting Suricata.
间隔和其他几个选项取决于上面描述的全局统计信息部分。
10.1.8.10. 系统日志
使用此选项,可以将所有警报和事件输出发送到syslog。
- syslog:                       #This is a output-module to direct log-output to several directions.
     enabled: no                #The use of this output-module is not enabled.
     facility: local5           #In this option you can set a syslog facility.
     level: Info                #In this option you can set the level of output. The possible levels are:
                                #Emergency, Alert, Critical, Error, Warning, Notice, Info and Debug.
10.1.8.11. 文件存储(文件提取)
这个 file-store 输出允许将提取的文件存储到磁盘,并配置存储文件的位置。
下面显示了版本2的配置选项 file-store 输出。
- file-store:
    # This configures version 2 of the file-store.
    version: 2

    enabled: no

    # Set the directory for the filestore. If the path is not
    # absolute will be be relative to the default-log-dir.
    #dir: filestore

    # Write out a fileinfo record for each occurrence of a
    # file. Disabled by default as each occurrence is already logged
    # as a fileinfo record to the main eve-log.
    #write-fileinfo: yes

    # Force storing of all files. Default: no.
    #force-filestore: yes

    # Override the global stream-depth for sessions in which we want
    # to perform file extraction. Set to 0 for unlimited; otherwise,
    # must be greater than the global stream-depth value to be used.
    #stream-depth: 0

    # Uncomment the following variable to define how many files can
    # remain open for filestore by Suricata. Default value is 0 which
    # means files get closed after each write
    #max-open-files: 1000

    # Force logging of checksums, available hash functions are md5,
    # sha1 and sha256. Note that SHA256 is automatically forced by
    # the use of this output module as it uses the SHA256 as the
    # file naming scheme.
    #force-hash: [sha1, md5]
10.1.9. 检测引擎
10.1.9.1. 检查配置
检测引擎生成内部签名组。Suricata加载签名,将与网络流量进行比较。事实上,许多规则当然是不必要的。(例如:如果出现带有UDP协议的数据包,则不需要TCP协议的所有签名。)因此,所有签名将分组。但是,包含多个组的分发将使用大量内存。不是所有类型的签名都有自己的组。有一种可能,具有几个共同属性的不同签名将放在一个组中。组的数量将决定内存和性能之间的平衡。少量的组会降低性能,但占用的内存很少。对更多的组来说,相反的计数。引擎允许您管理内存和性能之间的平衡。为了管理这一点,(通过确定组的数量),有几个通用的选项:高性能表示高性能,多使用内存,低性能表示低性能,很少使用内存。选项介质是性能和内存使用之间的平衡。这是默认设置。自定义选项适用于高级用户。此选项具有可由用户管理的值。
detect:
  profile: medium
  custom-values:
    toclient-groups: 2
    toserver-groups: 25
  sgh-mpm-context: auto
  inspection-recursion-limit: 3000
在所有这些选项中,您可以添加(或更改)一个值。大多数签名都可以调整为只关注一个方向,即只关注服务器或客户机。
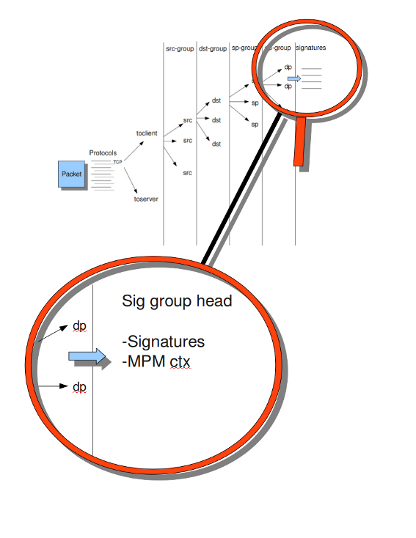
如果您看看示例4, the Detection-engine grouping tree 你看它有很多分支。在每个分支的末尾,实际上有一个“sig group head”。在该SIG组头中,有一个容器,其中包含一个对该特定组/该分支的特定端具有重要意义的签名列表。在SIG组头中,还可以找到多模式匹配器(MPM)的设置:MPM上下文。
正如将在“模式匹配设置”部分再次描述的,可以从中选择多个MPM算法。因为每个SIG组头都有自己的MPM上下文,一些算法使用大量内存。因此,可以选择sgh mpm context来设置组是共享一个mpm context,还是设置每个组都有自己的mpm context。
要设置选项sgh mpm context,可以从auto、full或single中选择。默认设置为“自动”,表示Suricata根据您使用的算法选择完整或单个。“完整”意味着每个组都有自己的MPM上下文,“单一”意味着所有组共享一个MPM上下文。AC和AC GFB这两种算法在1.03中是新的。如果SGH MPM上下文设置为“自动”,则这些算法使用单个MPM上下文。在这种情况下,其余的算法都使用full。
检查递归限制选项必须减轻可能导致大问题的错误。通常,苏里达必须处理复杂的问题。它可能会因为一个错误而陷入“无休止的循环”,这意味着它会一遍又一遍地重复它的操作。通过选项检查递归限制,可以限制此操作。
Example 4 Detection-engine grouping tree
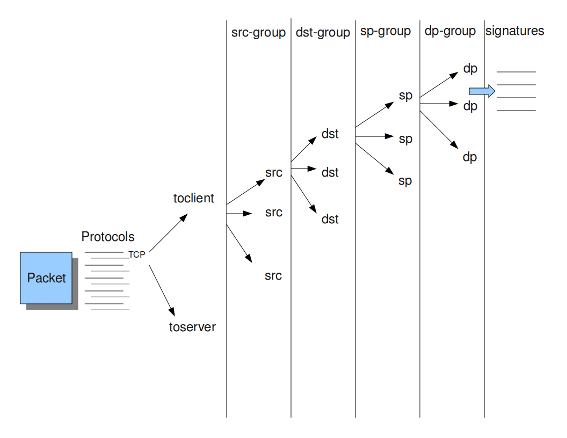
src             Stands for source IP-address.
dst             Stands for destination IP-address.
sp              Stands for source port.
dp              Stands for destination port.
示例5细节分组树
10.1.9.2. 预滤器发动机
预过滤的概念是有太多的规则需要单独检查。Prefilter采用的方法是从每个规则中向Prefilter添加一个条件,然后在一个步骤中对其进行检查。最常见的例子是MPM(也称为Fast_模式)。这为每个规则采用一个模式,并将其添加到MPM中。仅对MPM阶段中至少有一个模式匹配的规则执行个别检查。
在MPM旁边,其他类型的关键字支持预过滤。例如,icmp-type、icode、icmp-seq和icmp-id。TCP窗口、IP TTL是其他示例。
有关支持预筛选的关键字的完整列表,请参阅:
suricata --list-keywords=all
Surica可以自动选择预过滤选项,也可以手动设置。
detect:
  prefilter:
    default: mpm
默认情况下,只使用mpm/fast_模式。
然后,可以使用“prefilter”关键字在特定规则中启用其他非MPM关键字的预筛选引擎。
例如。
alert ip any any -> any any (ttl:123; prefilter; sid:1;)
要让Suricata做出这些决定,请将默认值设置为“自动”:
detect:
  prefilter:
    default: auto
10.1.9.3. 模式匹配器设置
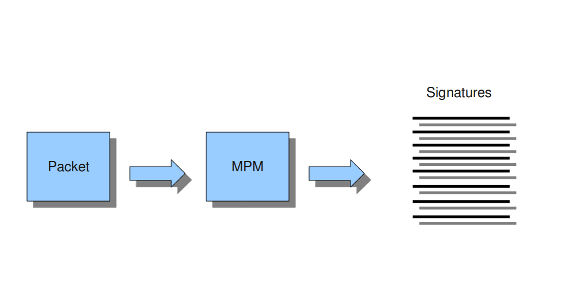
多模式匹配器(MPM)是Suricata中的检测引擎的一部分,可以同时搜索多个模式。通常,签名有一个或多个模式。对于每个签名,多模式匹配器使用一个模式。这样Suricata就可以排除许多签名,因为只有当所有的模式都匹配时,签名才能匹配。
以下是程序:
一个包裹进来了。
在寻找匹配的模式时,多模式匹配器将对打包的数据进行分析。
所有匹配的模式将由Suricata(签名)进一步处理。
Example 8 Multi-pattern-matcher
Suricata提供了不同的多模式匹配器算法的各种实现,如下所示。
要设置多模式匹配器算法:
mpm-algo: ac
在“mpm algo”之后,可以输入以下算法之一:ac、hs和ac ks。
论 x86_64 为了获得最佳性能,应使用hs(Hyperscan)。
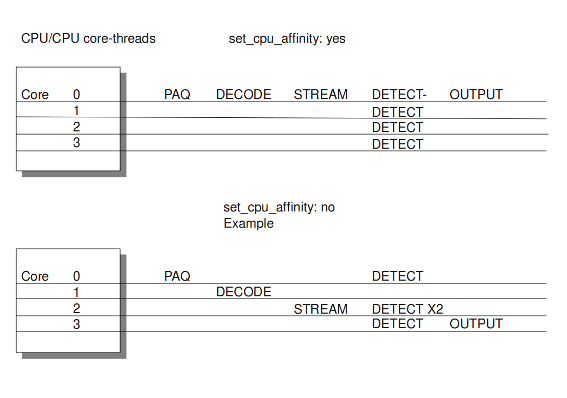
10.1.10. 穿线
Suricata是多线程的。Suricata使用多个CPU/CPU核心,因此它可以同时处理许多网络数据包。(在单核引擎中,将一次处理一个数据包。)
有四个线程模块:包获取、解码和流应用层、检测和输出。
#数据包采集模块从网络中读取数据包。
#解码模块对数据包进行解码,流应用层有三个任务:
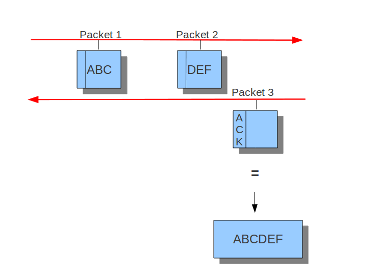
First: it performs stream-tracking, meaning it is making sure all steps will be taken to make a correct network-connection.
Second: TCP-network traffic comes in as packets. The Stream-Assembly engine reconstructs the original stream.
Finally: the application layer will be inspected. HTTP and DCERPC will be analyzed.
#检测线程将比较签名。可能有多个检测线程,因此它们可以同时运行。
#在输出中,将处理所有警报和事件。
例6穿线
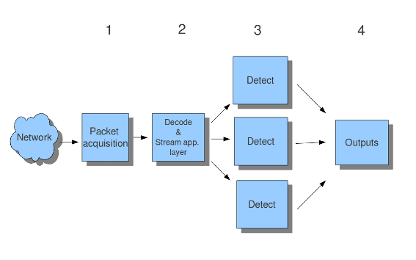
Packet acquisition:             Reads packets from the network
Decode:                         Decodes packets.
Stream app. Layer:              Performs stream-tracking and reassembly.
Detect:                         Compares signatures.
Outputs:                        Processes all events and alerts.
大多数计算机都有多个CPU/CPU核心。默认情况下,操作系统决定哪个核心在哪个线程上工作。当一个内核已经被占用时,另一个内核将被指定在线程上工作。所以,哪个核心在哪个线程上工作,可能会不时地有所不同。
线程中有一个选项:
set-cpu-affinity: no
使用此选项,您可以使Suricata为每个线程设置固定核心。在这种情况下,1、2和4位于核心0(零)。每个核心都有自己的检测线程。在核心0上运行的检测线程的优先级低于在核心0上运行的其他线程。如果要占用这些其他核心,则核心0上的检测线程没有太多要处理的数据包。在其他核心上运行的检测线程将处理更多数据包。只有在将选项设置为“是”后才会出现这种情况。
示例7平衡工作负载
可以设置检测线程比率:
detect-thread-ratio: 1.5
检测线程比率将确定检测线程的数量。默认情况下,它将是计算机中CPU/CPU核心数量的1.5倍。这将导致比CPU/CPU核心拥有更多的检测线程。这意味着你对核心数量的订阅过多。在必须等待检测线程的时候,这可能很方便。剩余的检测线程可以变为活动的。
在“CPU关联”选项中,您可以设置哪个CPU/内核在哪个线程上工作。在这个选项中有几个线程集。管理、接收、工人和裁决集。这些是固定名称,不能更改。对于每一组,有几个选项:CPU、模式和PRIO。在“cpu”选项中,您可以设置将从该集合运行线程的cpu/核心的数量。您可以将此选项设置为“全部”,使用范围(0-3)或逗号分隔列表(0,1)。选项“mode”可以设置为“balanced”或“exclusive”。当设置为“balanced”时,单个线程可以由选项“cpu”中设置的所有核心处理。如果选项'mode'设置为'exclusive',则每个线程都有固定的内核。如前所述,线程可以具有不同的优先级。在“prio”选项中,可以为每个线程设置优先级。此优先级可以是低、中、高,也可以将优先级设置为“默认”。如果不为CPU设置优先级,则“默认”中的设置将计数。默认情况下,Surica为每个可用的CPU/CPU核心创建一个“检测”(工作)线程。
cpu-affinity:
  - management-cpu-set:
      cpu: [ 0 ]  # include only these cpus in affinity settings
  - receive-cpu-set:
      cpu: [ 0 ]  # include only these cpus in affinity settings
  - worker-cpu-set:
      cpu: [ "all" ]
      mode: "exclusive"
      # Use explicitely 3 threads and don't compute number by using
      # detect-thread-ratio variable:
      # threads: 3
      prio:
        low: [ 0 ]
        medium: [ "1-2" ]
        high: [ 3 ]
        default: "medium"
  - verdict-cpu-set:
      cpu: [ 0 ]
      prio:
        default: "high"
10.1.10.1. IDS/IPS模式的相关CPU关联设置
10.1.10.2. IDS模式
运行模式自动调整:
management-cpu-set - used for management (example - flow.managers, flow.recyclers)
receive-cpu-set - used for receive and decode
worker-cpu-set - used for streamtcp,detect,output(logging),reject
谣传工作者:
management-cpu-set - used for management (example - flow.managers, flow.recyclers)
worker-cpu-set - used for receive,streamtcp,decode,detect,output(logging),respond/reject
10.1.10.3. IPS模式
运行模式自动调整:
management-cpu-set - used for management (example - flow.managers, flow.recyclers)
receive-cpu-set - used for receive and decode
worker-cpu-set - used for streamtcp,detect,output(logging)
verdict-cpu-set - used for verdict and respond/reject
运行模式工人:
management-cpu-set - used for management (example - flow.managers, flow.recyclers)
worker-cpu-set - used for receive,streamtcp,decode,detect,output(logging),respond/reject, verdict
10.1.11. IP碎片整理
偶尔网络数据包会出现碎片。在某些网络上,这种情况比在其他网络上更常见。零碎的包由许多部分组成。在Suricata能够准确地检查这些数据包之前,必须对这些数据包进行重构。这将由Suricata的一个组件完成;碎片整理引擎。碎片整理引擎重建碎片化数据包后,引擎将重新组装的数据包发送给Suricata的其余部分。
defrag中有三个选项:max frags、prealloc和timeout。在Suricata接收到一个包的片段时,它将该包的其他片段保存在内存中,以便很快完成该包。然而,有可能其中一个碎片没有出现。为了防止Suricata继续等待该数据包(从而使用内存),Suricata有一个时间跨度,在此时间跨度之后将丢弃碎片。这在60秒后默认发生。
defrag:
  max-frags: 65535
  prealloc: yes
  timeout: 60
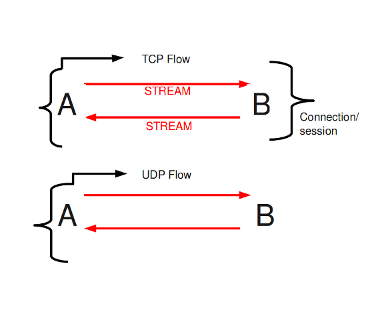
10.1.12. 流量和流量处理
10.1.12.1. 流量设置
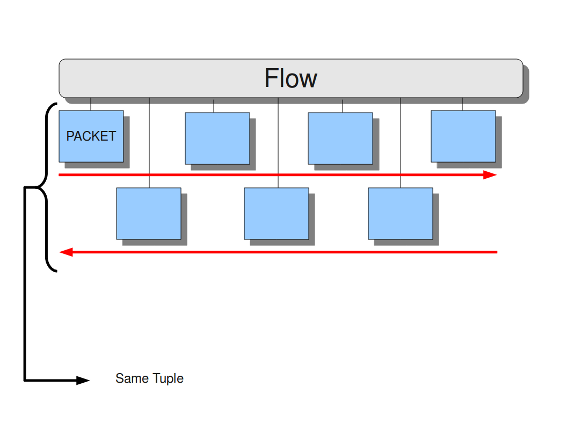
在苏里达,流量是非常重要的。它们在Suricata内部组织数据的方式中发挥了很大作用。流与连接有点类似,只是流更一般。所有具有相同元组(协议、源IP、目标IP、源端口、目标端口)的数据包都属于同一个流。属于流的包在内部连接到它。
示例9流程
示例10元组
跟踪所有这些流,使用内存。流越多,所需的内存就越多。
要保持对内存使用的控制,有几个选项:
用于设置流引擎将使用的最大字节数的memcap选项、用于设置哈希表大小的哈希大小以及用于以下内容的预分配:
对于还不属于流的数据包,Suricata创建了一个新的流。这是一个相对昂贵的行动。由此带来的风险是,攻击者/黑客可以在此部分攻击引擎系统。当它们确保一台计算机获得许多具有不同元组的数据包时,引擎必须生成许多新的流。这样,攻击者就可以淹没系统。为了减轻引擎过载,此选项指示Suricata在内存中保持多个流就绪。这样一来,Suricata就不那么容易受到此类攻击。
流引擎有一个独立于包处理的管理线程。这个线程称为流管理器。该螺纹确保尽可能在Memcap内。将准备10000个流量。
flow:
  memcap: 33554432              #The maximum amount of bytes the flow-engine will make use of.
  hash_size: 65536              #Flows will be organized in a hash-table. With this option you can set the
                                #size of the hash-table.
  Prealloc: 10000               #The amount of flows Suricata has to keep ready in memory.
此时MEMCAP仍将到达,尽管预分配,流量发动机进入紧急模式。在此模式下,发动机将利用较短的超时时间。它让流以更具侵略性的方式到期,因此新流将有更多的空间。
有两种选择:紧急恢复和修剪流程。紧急恢复设置为30。这是流量引擎恢复正常后的预分配流量百分比(10000个流量的30%完成时)。
如果在紧急模式中,过度超时没有所需的结果,则此选项是最终的解决方案。它结束了一些流,即使他们还没有达到他们的超时时间。“修剪流”选项显示每次设置新流时将终止的流的数量。
emergency_recovery: 30                  #Percentage of 1000 prealloc'd flows.
prune_flows: 5                          #Amount of flows being terminated during the emergency mode.
10.1.12.2. 流量超时
流超时决定了在内存中保持流的时间量。
流可以处于不同的状态。Suricata区分TCP和UDP的三种流状态。对于TCP,这些是:新的、已建立的和已关闭的,仅适用于新的和已建立的UDP。对于这些州中的每一个,Suricata都可以采用不同的超时。
TCP流中的新状态表示三路握手期间的时间。所建立的状态是三路握手完成时的状态。TCP流中关闭的状态:有几种方法可以终止流。这是通过重置或四路Fin握手实现的。
在UDP流中是新的:仅从一个方向发送数据包的状态。
在UDP流中建立:包从两个方向发送。
在示例配置中,是每个协议的设置。TCP、UDP、ICMP和默认(所有其他协议)。
flow-timeouts:

  default:
    new: 30                     #Time-out in seconds after the last activity in this flow in a New state.
    established: 300            #Time-out in seconds after the last activity in this flow in a Established
                                #state.
    emergency_new: 10           #Time-out in seconds after the last activity in this flow in a New state
                                #during the emergency mode.
    emergency_established: 100  #Time-out in seconds after the last activity in this flow in a Established
                                #state in the emergency mode.
  tcp:
    new: 60
    established: 3600
    closed: 120
    emergency_new: 10
    emergency_established: 300
    emergency_closed: 20
  udp:
    new: 30
    established: 300
    emergency_new: 10
    emergency_established: 100
  icmp:
    new: 30
    established: 300
    emergency_new: 10
    emergency_established: 100
10.1.12.3. 流式发动机
流引擎跟踪TCP连接。引擎由两部分组成:流跟踪引擎和重新组装引擎。
流跟踪引擎监视连接的状态。重新组装的发动机会像以前那样重建流程,所以它会被诊断出来。
流引擎有两个可设置的memcaps。一个用于流跟踪引擎,另一个用于重新组装引擎。
流跟踪引擎将流的信息保存在内存中。有关状态、TCP序列号和TCP窗口的信息。为了保存这些信息,它可以利用memcap允许的容量。
TCP数据包有一个所谓的校验和。这是一个内部代码,可以查看数据包是否已到达良好状态。流引擎不会处理校验和错误的数据包。可以通过输入“否”而不是“是”来设置此选项。
stream:
  memcap: 64mb                # Max memory usage (in bytes) for TCP session tracking
  checksum_validation: yes    # Validate packet checksum, reject packets with invalid checksums.
为了减轻Suricata因快速会话创建而过载的情况,prealloc_sessions选项指示Suricata在内存中保持多个会话就绪。
TCP会话以三向握手开始。之后,数据就可以发送或接收。会话可以持续很长时间。可能会在启动了几个TCP会话后启动Suricata。这样,Suricata会错过这些会话的原始设置。这个设置总是包含很多信息。如果希望Suricata从那时起检查流,可以通过将选项“Midstream”设置为“true”来进行检查。默认设置为“假”。通常,Suricata能够看到连接的所有数据包。不过,有些网络使其更加复杂。一些网络流量遵循与另一部分不同的路径,换句话说:流量是异步的。为了确保Suricata会检查它所看到的一个部分,而不是感到困惑,“AsyncOneSide”选项将被激活。默认情况下,选项设置为“false”。
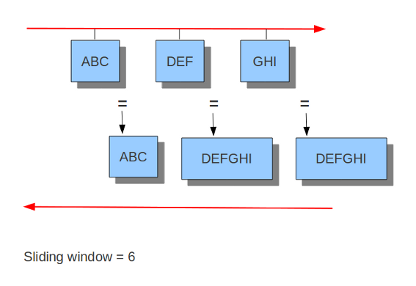
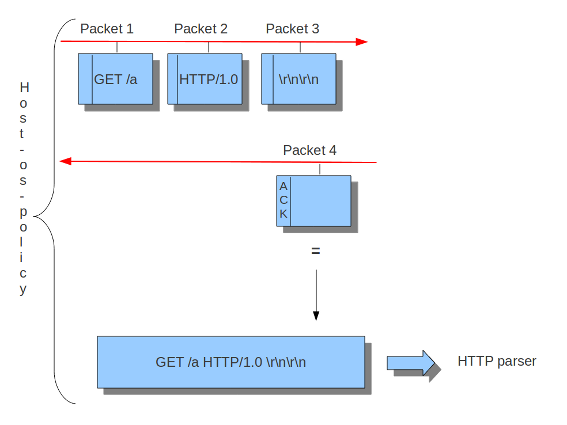
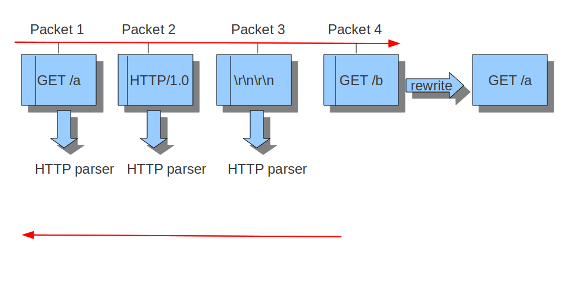
Suricata以块的形式检查Normal/ID模式中的内容。在inline/ips模式下,它在滑动窗口方式(见示例….)上执行此操作。如果Suricata设置为inline模式,则必须在将数据包发送给接收器之前立即检查数据包。这样,Suricata可以在需要时直接丢弃数据包。(参见示例…)重要的是Suricata要注意它正在处理的操作系统,因为操作系统在处理流中异常的方式上有所不同。参见 主机操作系统策略 .
prealloc_sessions: 32768     # 32k sessions prealloc'd
midstream: false             # do not allow midstream session pickups
async_oneside: false         # do not enable async stream handling
inline: no                   # stream inline mode
drop-invalid: yes            # drop invalid packets
bypass: no
这个 drop-invalid 选项可以设置为no以避免阻塞流引擎认为无效的数据包。这对于覆盖某些第2层IPS设置中出现的一些奇怪情况非常有用。
这个 bypass 当会话的任何一方到达其 depth .
警告
bypass 可能导致错过重要交通。小心使用。
Example 11 Normal/IDS mode
Suricata以块的形式检查流量。
Example 12 Inline/IPS Sliding Window
Suricata以滑动窗口的方式检查交通。
Example 13 Normal/IDS (reasembly on ACK'D data)
Example 14 Inline/IPS (reassembly on UNACK'D data)
重新组装引擎必须将数据段保存在内存中,以便能够重建流。为了避免资源不足,使用memcap限制使用的内存。
重新组装流是一项昂贵的操作。通过选项“深度”,可以控制流重新组装的范围。默认为1MB。执行文件提取的协议分析器可以覆盖每个流的此设置。
对重新组装的数据进行分块检查。这些块的大小设置为 toserver_chunk_size 和 toclient_chunk_size .为了避免边界的可预测性,可以通过添加一个随机因素来改变面包车的大小。
reassembly:
  memcap: 256mb             # Memory reserved for stream data reconstruction (in bytes)
  depth: 1mb                # The depth of the reassembling.
  toserver_chunk_size: 2560 # inspect raw stream in chunks of at least this size
  toclient_chunk_size: 2560 # inspect raw stream in chunks of at least
  randomize-chunk-size: yes
  #randomize-chunk-range: 10
“原始”重新组装通过简单的 content , pcre 关键字使用和其他有效载荷检查没有在特定的协议缓冲区上完成,如 http_uri .这种类型的重新组装可以关闭:
reassembly:
  raw: no
传入的段存储在流中的列表中。为了避免恒定的内存分配,使用了每个线程池。
reassembly:
  segment-prealloc: 2048    # pre-alloc 2k segments per thread
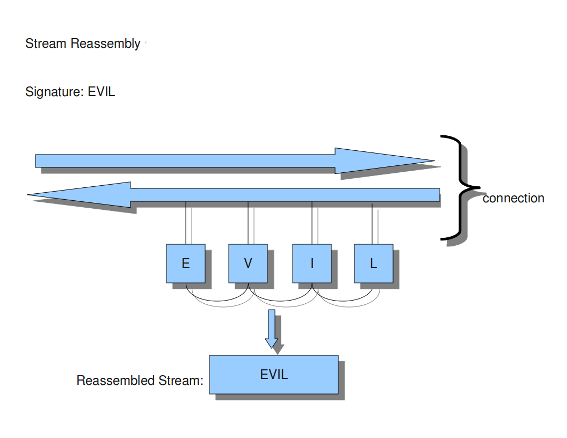
在同一序列号上重新发送不同的数据是一种混淆网络检测的方法。
reassembly:
  check-overlap-different-data: true
示例15流重新组装

10.1.13. 应用层分析器
10.1.13.1. ASN1_最大_帧(1.0.3和1.1中的新帧)
ASN1型 (Abstract Syntax One )是构造和描述数据的标准符号。
在asn1_max_帧中有几个帧。为了保护自身,Suricata最多将检查256个。如果需要,您可以将此金额设置为不同的值。
应用层协议,如X.400电子邮件、X.500和LDAP目录服务、H.323(VoIP)、BACnet和SNMP,使用ASN.1描述它们交换的协议数据单元(PDU)。在城市轨道交通的出入口和非出入口地层中也有广泛的应用。
要解码的ASN1帧的最大数目限制(默认256):
asn1_max_frames: 256
10.1.13.2. 配置HTTP(libhtp)
Suricata正在使用libhtp库来解析HTTP会话。
在处理HTTP流量时,Suricata需要处理不同类型的服务器,每个服务器处理HTTP流量中的异常情况也不同。最常见的web服务器是Apache。这是一个开源的web服务器程序。
除了Apache之外,微软的web服务器程序IIS(internetinformationservices/Server)也很有名。
与主机操作系统策略一样,Suricata需要知道哪个服务器使用哪个IP地址/网络地址。在Libhtp中,将web服务器分配给IP和网络地址称为personality。
当前可用的个性:
极小值
通用的
ID(默认)
IIS_4_0
IIS_5_0
IIS_5_1
IIS_6_0
IIS_7_0
IIS_7_5
阿帕奇
Apache_2_2
可以为每个设置块指定名称。在本例中是-apache和-iis7。在这些名称下你可以设置IP地址,网络地址的个性和一套功能。
特定于版本的特性确切地知道web服务器的行为,并对此进行仿真。IDS personality会尝试实现一种在您不知道具体情况的情况下能够相当好地工作的最佳方法。
默认配置也适用于没有特定设置可用的每个IP地址。
HTTP请求体通常很大,因此它们需要大量的时间来处理,这对性能有很大的影响。使用“请求正文限制”选项,您可以设置将要检查的客户端主体的限制(以字节为单位)。将其设置为0将检查所有实体。
HTTP响应主体也是如此。
libhtp:

  default-config:
    personality: IDS
    request-body-limit: 3072
    response-body-limit: 3072

  server-config:
     - apache:
         address: [192.168.1.0/24, 127.0.0.0/8, "::1"]
         personality: Apache_2_2
         request-body-limit: 0
         response-body-limit: 0

     - iis7:
         address:
           - 192.168.0.0/24
           - 192.168.10.0/24
         personality: IIS_7_0
         request-body-limit: 4096
         response-body-limit: 8192
Suricata为用户提供了一整套libhtp定制。
现在可以在conf中使用这些参数来定制suricata对libhtp的使用。
# Configures whether backslash characters are treated as path segment
# separators. They are not on Unix systems, but are on Windows systems.
# If this setting is enabled, a path such as "/one\two/three" will be
# converted to "/one/two/three".  Accepted values - yes, no.
#path-convert-backslash-separators: yes

# Configures whether input data will be converted to lowercase.
#path-convert-lowercase: yes

# Configures how the server reacts to encoded NUL bytes.
#path-nul-encoded-terminates: no

# Configures how the server reacts to raw NUL bytes.
#path-nul-raw-terminates: no

# Configures whether consecutive path segment separators will be
# compressed. When enabled, a path such as "/one//two" will be normalized
# to "/one/two". The backslash_separators and decode_separators
# parameters are used before compression takes place. For example, if
# backslash_separators and decode_separators are both enabled, the path
# "/one\\/two\/%5cthree/%2f//four" will be converted to
# "/one/two/three/four".  Accepted values - yes, no.
#path-separators-compress: yes

# Configures whether encoded path segment separators will be decoded.
# Apache does not do this, but IIS does. If enabled, a path such as
# "/one%2ftwo" will be normalized to "/one/two". If the
# backslash_separators option is also enabled, encoded backslash
# characters will be converted too (and subsequently normalized to
# forward slashes).  Accepted values - yes, no.
#path-separators-decode: yes

# Configures whether %u-encoded sequences in path will be decoded. Such
# sequences will be treated as invalid URL encoding if decoding is not
# desireable.  Accepted values - yes, no.
#path-u-encoding-decode: yes

# Configures how server reacts to invalid encoding in path.  Accepted
# values - preserve_percent, remove_percent, decode_invalid, status_400
#path-url-encoding-invalid-handling: preserve_percent

# Controls whether the data should be treated as UTF-8 and converted
# to a single-byte stream using best-fit mapping
#path-utf8-convert-bestfit:yes

# Sets the replacement character that will be used to in the lossy
# best-fit mapping from Unicode characters into single-byte streams.
# The question mark is the default replacement character.
#path-bestfit-replacement-char: ?

# Configures whether plus characters are converted to spaces
# when decoding URL-encoded strings.
#query-plusspace-decode: yes

#   response-body-decompress-layer-limit:
#                           Limit to how many layers of compression will be
#                           decompressed. Defaults to 2.

#   uri-include-all:        Include all parts of the URI. By default the
#                           'scheme', username/password, hostname and port
#                           are excluded.

#   meta-field-limit:       Hard size limit for request and response size
#                           limits.

# inspection limits
    request-body-minimal-inspect-size: 32kb
    request-body-inspect-window: 4kb
    response-body-minimal-inspect-size: 40kb
    response-body-inspect-window: 16kb

# auto will use http-body-inline mode in IPS mode, yes or no set it statically
    http-body-inline: auto

# Decompress SWF files.
# 2 types: 'deflate', 'lzma', 'both' will decompress deflate and lzma
# compress-depth:
# Specifies the maximum amount of data to decompress,
# set 0 for unlimited.
# decompress-depth:
# Specifies the maximum amount of decompressed data to obtain,
# set 0 for unlimited.
    swf-decompression:
      enabled: yes
      type: both
      compress-depth: 0
      decompress-depth: 0

# Take a random value for inspection sizes around the specified value.
# This lower the risk of some evasion technics but could lead
# detection change between runs. It is set to 'yes' by default.
#randomize-inspection-sizes: yes
# If randomize-inspection-sizes is active, the value of various
# inspection size will be choosen in the [1 - range%, 1 + range%]
# range
# Default value of randomize-inspection-range is 10.
#randomize-inspection-range: 10

# Can enable LZMA decompression
#lzma-enabled: false
# Memory limit usage for LZMA decompression dictionary
# Data is decompressed until dictionary reaches this size
#lzma-memlimit: 1 Mb
# Maximum decompressed size with a compression ratio
# above 2048 (only reachable by LZMA)
#compression-bomb-limit: 1 Mb
# Maximum time spent decompressing a single transaction in usec
#decompression-time-limit: 100000
其他参数可从Suricata自定义。:
#   double-decode-path:     Double decode path section of the URI
#   double-decode-query:    Double decode query section of the URI
10.1.14. 减压-时限
实施解压时间限制,以避免由于输入资源耗尽而导致的DOS,例如解压炸弹(通过模糊化发现)。限制越低,对DOS的保护越好,但这也可能导致误报。如果达到时间限制,则应用程序层事件 http.compression_bomb 已设置(此事件也可以从其他条件设置)。在较慢的配置(硬件、ASAN等)上可能会发生这种情况
10.1.14.1. 配置SMB(Rust)
注解
对于完整的SMB支持,请使用Rust支持编译Suricata
SMB解析器将通过TCP解析SMB协议的版本1、2和3。
要启用解析器,请将以下内容添加到 app-layer 山药的一部分。
smb:
  enabled: yes
  detection-ports:
    dp: 139, 445
解析器使用基于模式的协议检测,并将回退到 probing parsers 如果基于模式的检测失败。与往常一样,基于模式的检测与端口无关。这个 probing parsers 只能在 detection-ports .
SMB通常用于传输DCERPC协议。这个解析器也处理这个流量。
10.1.15. 发动机记录
引擎日志记录系统记录有关应用程序的信息,例如在启动、运行和关闭Suricata引擎期间的错误和其他诊断信息。这不包括Suricata生成的警报和事件。
发动机日志记录系统具有以下日志级别:
错误
警告
通知
信息
性能
配置
调试
注意,只有在使用 --enable-debug 配置选项。
日志配置中的第一个选项是默认日志级别。此选项确定将显示的信息的严重性/重要性级别。低于此处设置的级别的消息将不会显示。默认设置为信息。这意味着将显示错误、警告和信息,而其他级别将不会显示。
10.1.15.1. 默认配置示例
# Logging configuration.  This is not about logging IDS alerts/events, but
# output about what Suricata is doing, like startup messages, errors, etc.
logging:
  # The default log level, can be overridden in an output section.
  # Note that debug level logging will only be emitted if Suricata was
  # compiled with the --enable-debug configure option.
  #
  # This value is overridden by the SC_LOG_LEVEL env var.
  default-log-level: notice

  # The default output format.  Optional parameter, should default to
  # something reasonable if not provided.  Can be overridden in an
  # output section.  You can leave this out to get the default.
  #
  # This value is overridden by the SC_LOG_FORMAT env var.
  #default-log-format: "[%i] %t - (%f:%l) <%d> (%n) -- "

  # A regex to filter output.  Can be overridden in an output section.
  # Defaults to empty (no filter).
  #
  # This value is overridden by the SC_LOG_OP_FILTER env var.
  default-output-filter:

  # Define your logging outputs.  If none are defined, or they are all
  # disabled you will get the default - console output.
  outputs:
  - console:
      enabled: yes
      # type: json
  - file:
      enabled: yes
      level: info
      filename: suricata.log
      # type: json
  - syslog:
      enabled: no
      facility: local5
      format: "[%i] <%d> -- "
      # type: json
10.1.15.2. 默认日志级别
例子::
logging:
  default-log-level: info
此选项设置默认日志级别。默认日志级别为 notice . 如果未另行设置,则将在单个日志记录配置(控制台、文件、syslog)中使用此值。
注解
这个 -v 命令行选项可用于在运行时快速增加日志级别。看到了吗 the -v command line option .
这个 default-log-level 可以重写配置值中的设置 SC_LOG_LEVEL 环境变量。
10.1.15.3. 默认日志格式
测井线由两部分组成。首先显示元信息(线程ID、日期等),最后显示实际的日志消息。例子:
[27708] 15/10/2010 -- 11:40:07 - (suricata.c:425) <Info> (main) – This is Suricata version 1.0.2
(以下是元信息之前的部分,“这是Suricata 1.0.2”是实际消息。)
可以确定此行中显示的信息以及(显示方式)将以何种格式显示。此选项是所谓的格式字符串:
default-log-format: "[%i] %t - (%f:%l) <%d> (%n) -- "
%后面跟一个字符,有特殊的含义。有八个特定标志:
t:      Time, timestamp, time and date
                      example: 15/10/2010 - -11:40:07
p:      Process ID. Suricata's whole processing consists of multiple threads.
i:      Thread ID. ID of individual threads.
m:      Thread module name. (Outputs, Detect etc.)
d:      Log-level of specific log-event. (Error, info, debug etc.)
f:      Filename. Name of C-file (source code) where log-event is generated.
l:      Line-number within the filename, where the log-event is generated in the source-code.
n:      Function-name in the C-code (source code).
最后三个方面,F、L和N主要是方便开发人员使用的。
日志格式可以在命令行中被环境变量sc_log_format覆盖。
10.1.15.4. 输出滤波器
在日志记录中,您可以设置输出过滤器。使用这个输出过滤器,您可以设置应该显示事件日志的哪个部分。可以提供正则表达式(regex)。如果regex匹配,将显示一行。
default-output-filter: #In this option the regular expression can be entered.
此值被环境变量:SC_LOG_OP_FILTER覆盖
10.1.15.5. 日志输出
显示输出有不同的方式。输出可以直接显示在屏幕上,也可以放在文件中或通过系统日志。最后提到的是一个高级的日志管理工具。该工具可用于将日志输出定向到不同的位置(文件、其他计算机等)。
outputs:
  - console:                                    #Output on your screen.
      enabled: yes                              #This option is enabled.
      #level: notice                            #Use a different level than the default.
  - file:                                       #Output stored in a file.
      enabled: no                               #This option is not enabled.
      filename: /var/log/suricata.log           #Filename and location on disc.
      level: info                               #Use a different level than the default.
  - syslog:                                     #This is a program to direct log-output to several directions.
      enabled: no                               #The use of this program is not enabled.
      facility: local5                          #In this option you can set a syslog facility.
      format: "[%i] <%d> -- "                   #The option to set your own format.
      #level: notice                            #Use a different level than the default.
10.1.16. 数据包获取
10.1.16.1. PF环
pf_环是一个库,旨在提高libcap上的包捕获性能。它执行数据包采集。pf_环中有三个选项:接口、集群ID和集群类型。
pfring:
  interface: eth0    # In this option you can set the network-interface
                     # on which you want the packets of the network to be read.
pf_环将根据流量加载平衡数据包。所有将参与负载平衡的包获取线程都需要具有相同的群集ID。确保此ID对于此线程群集是唯一的,这样其他引擎/程序就不会使用具有相同ID的群集,这一点很重要。
cluster-id: 99
pf_环可以使用pf_环群来平衡流量。pf_环网的所有流量都可以通过两种方式之一进行负载平衡,一种是循环方式,另一种是作为同一集群一部分的单流方式。pf_环的所有流量将在相同集群ID的采集线程之间进行负载平衡。
集群循环方式是一种将数据包一次一个地分发给每个线程的方式(例如将扑克牌分发给其他玩家)。集群流方式是将同一流的所有数据包分发到同一线程的一种方式。流本身将以循环方式分发到线程。
cluster-type: cluster_round_robin
10.1.16.2. NFQ
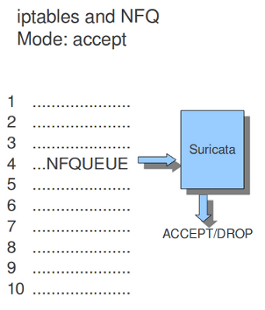
在iptables规则中使用nfqueue,会将包发送到suricata。如果模式设置为“接受”,则通过使用NFQ的规则发送给Suricata的数据包在经过Suricata处理后,默认情况下不会被其余的iptables规则检查。如果需要的话,NFQ还有更多的选择来改变这一点。
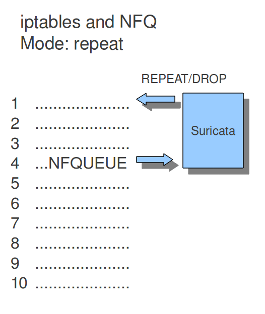
如果模式设置为“重复”,则包将被Suricata标记,并在iptables的第一个规则处重新注入。为了减少数据包在循环中循环,将跳过使用NFQ的规则,因为标记。
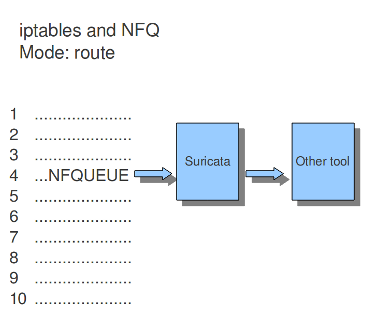
如果将模式设置为“路由”,则可以确保数据包在经过Suricata处理后将发送到另一个工具。可以在“路由队列”的强制选项中分配此工具。每个引擎/工具都链接到一个队列号。这个号码可以添加到NFQ规则和路由队列选项中。
添加选项编号,重复标记并将队列路由到NFQ规则:
iptables -I FORWARD -m mark ! --mark $MARK/$MASK -j NFQUEUE
nfq:
   mode: accept                 #By default the packet will be accepted or dropped by Suricata
   repeat_mark: 1               #If the mode is set to 'repeat', the packets will be marked after being
                                #processed by Suricata.
   repeat_mask: 1
   route_queue: 2               #Here you can assign the queue-number of the tool that Suricata has to
                                #send the packets to after processing them.
示例1 NFQ1
模式:接受
示例2 NFQ
模式:重复
示例3 NFQ
模式:路由
10.1.16.3. IPFW公司
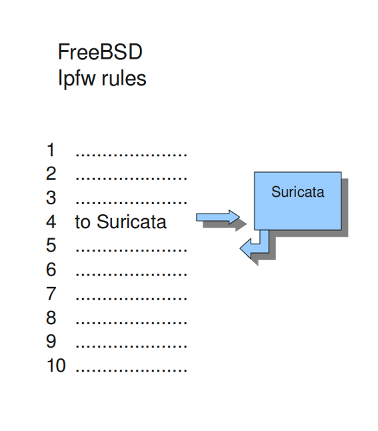
Suricata不仅支持Linux,还支持FreeBSD操作系统(这是一个开源的Unix操作系统)和Mac OS X。FreeBSD上的在线模式使用IPFW(IP防火墙)。
IPFW中的某些规则向Suricata发送网络流量。规则有数字。在此选项中,您可以设置网络流量将被放回的规则。确保这条规则是在发送流量到Suricata的规则之后制定的,否则它将绕圈运行。
以下命令引擎将数据包重新注入到规则5500处的IPFW防火墙中:
ipfw:
  ipfw-reinjection-rule-number: 5500
Example 16 Ipfw-reinjection.
10.1.17. 规则
10.1.17.1. 规则文件
对于不同的风险类别,可以使用包含一个或多个规则的不同规则文件。可以指示Suricata在何处找到这些规则以及要加载哪些规则以供使用。您可以设置可以找到文件的目录。
default-rule-path: /etc/suricata/rules/
rule-files:
  - backdoor.rules
  - bad-traffic.rules
  - chat.rules
  - ddos.rules
  - ....
上面提到的是一个可以从中选择的规则文件的示例。还有更多可用的规则文件。
如果需要,可以为特定规则或规则文件设置完整路径。在这种情况下,上述目录(/etc/suricata/rules/)将被该特定文件忽略。如果您编写自己的规则,并希望将其与其他规则(如VRT、ET或ET Pro)分开存储,这很方便。
如果设置了一个似乎不存在的文件名,SURICTA将忽略该条目,并在引擎启动期间显示一条错误消息。它将像往常一样继续启动。
10.1.17.2. 阈值文件
在这个选项中,您可以指定存储阈值文件的目录。默认目录是:/etc/suricata/threshold.config
10.1.17.3. 分类
分类文件是一种使规则目的明确的文件。
有些规则只是为了提供信息。其中一些是为了警告你,当你被黑客攻击等严重的风险。
在这个分类文件中,有一个部分提交给规则,使系统管理员能够区分事件。
此文件中的规则由三部分组成:短名称、说明和规则的优先级(其中1的优先级最高,4的优先级最低)。
您可以注意到规则和事件/警报中返回的这些描述。
Example:

configuration classification: misc-activity,Misc activity,3

Rule:

alert tcp $HOME_NET 21 -> $EXTERNAL_NET any (msg:"ET POLICY FTP Login Successful (non-anonymous)";
flow:from_server,established;flowbits:isset,ET.ftp.user.login; flowbits:isnotset,ftp.user.logged_in;
flowbits:set,ftp.user.logged_in; content:"230 ";pcre:!"/^230(\s+USER)?\s+(anonymous|ftp)/smi";
classtype:misc-activity; reference:urldoc.emergingthreats.net/2003410,;
reference:url,www.emergingthreats.net/cgi-bin/cvsweb.cgi/sigs/POLICY/POLICY_FTP_Login; sid:2003410; rev:7;)

Event/Alert:

10/26/10-10:13:42.904785  [**] [1:2003410:7] ET POLICY FTP Login Successful (non-anonymous) [**]
 [Classification: Misc activity[Priority: 3] {TCP} 192.168.0.109:21 -> x.x.x.x:34117
您可以设置分类配置的方向。
classification-file: /etc/suricata/classification.config
10.1.17.4. 规则变量
在规则中可以使用变量。
在规则中,可以设置应检查规则的IP地址以及不应检查规则的IP地址。
这样,只使用相关规则。为了防止您必须按规则设置此规则,有一个选项,您可以在其中为多个规则设置相关的IP地址。此选项包含将在规则中传递的地址组变量。所以,在家庭网络之后,您可以输入您的家庭IP地址。
vars:
  address-groups:
    HOME_NET: "[192.168.0.0/16,10.0.0.0/8,172.16.0.0/12]"        #By using [], it is possible to set
                                                                 #complicated variables.
    EXTERNAL_NET: any
    HTTP_SERVERS: "$HOME_NET"                                    #The $-sign tells that what follows is
                                                                 #a variable.
    SMTP_SERVERS: "$HOME_NET"
    SQL_SERVERS: "$HOME_NET"
    DNS_SERVERS: "$HOME_NET"
    TELNET_SERVERS: "$HOME_NET"
    AIM_SERVERS: any
使用大写字符是一种惯例。
有两种变量:地址组和端口组。它们都有相同的功能:更改规则,使其与您的需求相关。
在规则中,有一部分分配给地址,另一部分分配给端口。两者都有各自的变量。
必须设置所有选项。如果不需要设置特定地址,则应输入“any”。
port-groups:
  HTTP_PORTS: "80"
  SHELLCODE_PORTS: "!80"
  ORACLE_PORTS: 1521
  SSH_PORTS: 22
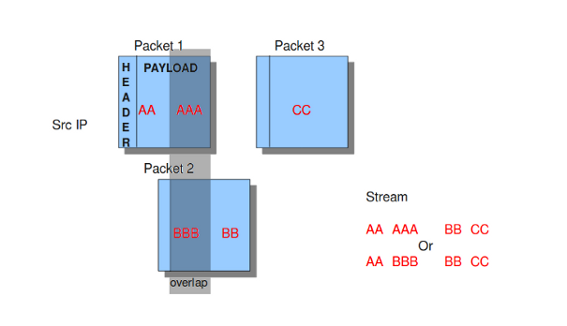
10.1.17.5. 主机操作系统策略
操作系统在处理零散数据包和流的方式上有所不同。对于不同的操作系统,Suricata的表现与异常情况不同。设置IP地址使用的操作系统很重要,因此Suricata知道如何处理零散的数据包和流。例如,在流重组中,可能存在具有重叠有效负载的包。
例17重叠有效载荷
在配置文件中,列出了操作系统。您可以在使用的操作系统名称后面添加您的IP地址。
host-os-policy:
  windows: [0.0.0.0/0]
  bsd: []
  bsd_right: []
  old_linux: []
  linux: [10.0.0.0/8, 192.168.1.100, "8762:2352:6241:7245:E000:0000:0000:0000"]
  old_solaris: []
  solaris: ["::1"]
  hpux10: []
  hpux11: []
  irix: []
  macos: []
  vista: []
  windows2k3: []
10.1.18. 发动机分析和分析
Suricata提供了几种分析规则性能和引擎本身的方法。
10.1.18.1. 发动机分析
选项引擎分析为签名编写者提供了有关Suricata如何在内部组织签名的信息。
如前所述,签名具有零个或多个可以匹配的模式。多模式匹配器(MPM)将只使用其中一个模式。除非使用快速模式规则选项,否则Suricata确定将使用哪种模式。
选项引擎分析在默认的日志目录中创建一个新的日志文件。在这个文件中,可以找到关于签名和模式的所有信息,这样签名编写器就能够看到使用的模式,并在需要时更改它。
要创建此日志文件,必须使用./src/suricata-c suricata.yaml--引擎分析运行suricata。
engine-analysis:
   rules-fast-pattern: yes
例子:
[10703] 26/11/2010 -- 11:41:15 - (detect.c:560) <Info> (SigLoadSignatures)
-- Engine-Analysis for fast_pattern printed to file - /var/log/suricata/rules_fast_pattern.txt

== Sid: 1292 ==
Fast pattern matcher: content
Fast pattern set: no
Fast pattern only set: no
Fast pattern chop set: no
Content negated: no
Original content: Volume Serial Number
Final content: Volume Serial Number

---

alert tcp any any -> any any (content:"abc"; content:"defghi"; sid:1;)

== Sid: 1 ==
Fast pattern matcher: content
Fast pattern set: no
Fast pattern only set: no
Fast pattern chop set: no
Content negated: no
Original content: defghi
Final content: defghi

---

alert tcp any any -> any any (content:"abc"; fast_pattern:only; content:"defghi"; sid:1;)

== Sid: 1 ==
Fast pattern matcher: content
Fast pattern set: yes
Fast pattern only set: yes
Fast pattern chop set: no
Content negated: no
Original content: abc
Final content: abc

---

alert tcp any any -> any any (content:"abc"; fast_pattern; content:"defghi"; sid:1;)

== Sid: 1 ==
Fast pattern matcher: content
Fast pattern set: yes
Fast pattern only set: no
Fast pattern chop set: no
Content negated: no
Original content: abc
Final content: abc

---

alert tcp any any -> any any (content:"abc"; fast_pattern:1,2; content:"defghi"; sid:1;)

== Sid: 1 ==
Fast pattern matcher: content
Fast pattern set: yes
Fast pattern only set: no
Fast pattern chop set: yes
Fast pattern offset, length: 1, 2
Content negated: no
Original content: abc
Final content: bc
10.1.18.2. 规则和数据包分析设置
规则分析是衡量规则价格的一部分。有些规则在检查交通时很昂贵。规则分析对于试图跟踪性能问题并解决它们的人来说很方便。也适用于签名者。
即使在配置文件中禁用了该选项,使用规则配置文件编译Suricata也会对性能产生影响。
要观察规则性能,有几个选项。
profiling:
  rules:
    enabled: yes
默认情况下不使用此引擎。仅当Suricata编译时使用:
-- enable-profiling
在每个会话结束时,Suricata将显示分析统计信息。列表将显示为已排序。
这个订单可以随意更改。可以在ticks、avgticks、checks、maxticks和matches之间进行选择。您选择的设置将从高到低显示。
检查签名所需的时间,将由法庭进行管理。这将以滴答计。一个勾号是一个CPU计算。3千兆赫将是30亿滴答。
除了检查、刻度和匹配的数量之外,它还将在每一个会话的末尾显示规则的平均值和最大值。
选项限制根据排序确定将显示统计信息的签名数量。
sort: avgticks
limit: 100
规则统计信息的外观示例;
Rule            Ticks            %     Checks         Matches           Max Tick         Avg
Ticks

7560            107766621       0.02    138             37              105155334       780917.54
11963           1605394413      0.29    2623             1              144418923       612045.14
7040            1431034011      0.26    2500             0              106018209       572413.60
5726            1437574662      0.26    2623             1              115632900       548065.06
7037            1355312799      0.24    2562             0              116048286       529005.78
11964           1276449255      0.23    2623             1              96412347        486637.15
7042            1272562974      0.23    2623             1              96405993        485155.54
5719            1233969192      0.22    2562             0              106439661       481642.93
5720            1204053246      0.21    2562             0              125155431       469966.14
10.1.18.3. 数据包分析
packets:

  # Profiling can be disabled here, but it will still have a
  # performance impact if compiled in.


  enabled: yes                                  #this option is enabled by default
  filename: packet_stats.log                    #name of the file in which packet profiling information will be
                                                #stored.
  append: yes                                   #If set to yes, new packet profiling information will be added to the
                                                #information that was saved last in the file.

  # per packet csv output
  csv:

    # Output can be disabled here, but it will still have a
    # performance impact if compiled in.

    enabled: no                                #the sending of packet output to a csv-file is by default disabled.
    filename: packet_stats.csv                 #name of the file in which csv packet profiling information will be
                                               #stored
默认情况下,在suricata.yaml中启用了数据包分析,但只有使用--enable profiling编译suricata时,它才会执行其任务。
将在其中存储数据包分析信息的文件名是packet-stats.log。可以将此文件中的信息添加到保存在该文件中的最后一个信息中,或者如果将“附加”选项设置为“否”,则现有文件将被覆盖。
每个包,您可以将输出发送到一个csv文件。此文件为每个数据包包含一行,其中包含该数据包的所有分析信息。只有在使用--enable profiling生成surica,并且在yaml中启用了包分析选项时,才能使用此选项。
如果您想分析代码的速度,最好使用runmode“single”。当使用单个线程时,不存在两个线程必须相互等待的情况。当使用两个线程时,在分析数据包时/分析数据包期间,线程可能需要等待对方的时间将被考虑在内。有关详细信息,请参阅 数据包分析 .
10.1.19. 应用程序层
10.1.19.1. SSL/TLS
ssl/tls解析器跟踪加密的sslv2、sslv3、tlsv1、tlsv1.1和tlsv1.2会话。
默认情况下,协议检测是使用模式和仅在TCP/443上运行的探测解析器完成的。基于模式的协议检测与端口无关。
tls:
  enabled: yes
  detection-ports:
    dp: 443

  # What to do when the encrypted communications start:
  # - default: keep tracking TLS session, check for protocol anomalies,
  #            inspect tls_* keywords. Disables inspection of unmodified
  #            'content' signatures.
  # - bypass:  stop processing this flow as much as possible. No further
  #            TLS parsing and inspection. Offload flow bypass to kernel
  #            or hardware if possible.
  # - full:    keep tracking and inspection as normal. Unmodified content
  #            keyword signatures are inspected as well.
  #
  # For best performance, select 'bypass'.
  #
  #encrypt-handling: default
10.1.19.1.1. 加密流量
加密通信没有解密,因此一旦握手完成,对会话的继续跟踪将受到限制。这个 encrypt-handling 选项控制握手后的行为。
如果 encrypt-handling 设置为 default (或者如果未设置该选项),SURICA将继续跟踪SSL/TLS会话。检验将受到限制,如未加工 content 检查仍将被禁用。在已知要加密的流量上进行模式匹配没有意义。检查(加密)心血和其他协议异常仍然发生。
什么时候? encrypt-handling 设置为 bypass ,此会话的所有处理都将停止。没有进一步的分析和检查。如果 stream.bypass 如果启用,这将导致绕过流,无论是在Suricata内部,还是通过捕获方法(如果它支持并为其配置的话)。
最后,如果 encrypt-handling 设置为 full ,Suricata将正常处理流程,无检查限制或旁路。
选项已替换 no-reassemble 选项。如果 no-reassemble 存在,并且 encrypt-handling 不是, false 被解释为 encrypt-handling: default 和 true 被解释为 encrypt-handling: bypass .
10.1.19.2. Modbus协议
根据TCP/IP实施指南v1.0b中的Modbus消息传递,建议使用远程设备保持TCP连接打开,不要为每个Modbus/TCP事务打开和关闭它。在这种情况下,重要的是将Modbus的流深度设置为无限制。
modbus:
  # Stream reassembly size for modbus, default is 0
  stream-depth: 0
10.1.19.3. MQTT
理论上MQTT消息的大小可能高达256MB,可能包含大量有效负载数据(例如属性、主题或已发布的有效负载),这些数据最终将被解析和记录。然而,为了承认大多数MQTT消息都非常小,并且为了减少发生拒绝服务问题的可能性,可以限制我们愿意解析的消息的最大长度。任何超过限制的消息都将使用减少的元数据进行记录,并且只根据字段的子集评估规则。默认值为1 MB。
mqtt:
  max-msg-length: 1mb
10.1.19.4. SMTP
SMTP解析器可以从附件中提取文件。也可以将原始对话提取为带有密钥的文件 raw-extraction .请注意,在这种情况下,整个会话将存储为一个文件,包括SMTP头和正文内容。文件名将设置为“rawmsg”。通常与文件相关的签名将与电子邮件的原始内容匹配。此配置参数具有 false 默认值。它与 decode-mime .如果两个都启用, raw-extraction 将自动禁用。
smtp:
  # extract messages in raw format from SMTP
  raw-extraction: true
10.1.20. 解码器
10.1.20.1. 特雷多
可以禁用Teredo解码器。默认情况下启用。
decoder:
  # Teredo decoder is known to not be completely accurate
  # it will sometimes detect non-teredo as teredo.
  teredo:
    enabled: true
    # ports to look for Teredo. Max 4 ports. If no ports are given, or
    # the value is set to 'any', Teredo detection runs on _all_ UDP packets.
    ports: $TEREDO_PORTS # syntax: '[3544, 1234]'
使用此默认配置,Teredo检测将在UDP端口3544上运行。如果 ports 缺少参数,或设置为 any ,将检查所有端口是否有Teredo。
10.1.21. 高级选项
10.1.21.1. 鲁阿吉特
10.1.21.1.1. 状态
Luajit有一个奇怪的内存需求,它的“状态”需要在进程的前2g内存中。因此,当使用luajit时,状态将在进程启动时分配。此选项控制预分配的状态数。
如果池耗尽,将生成警告。Suricata仍将尝试继续,但如果发动机的其他部件占用太多内存,则可能会失败。如果池已耗尽,将在发动机出口处打印提示。
状态分配如下:对于每个检测脚本,每个检测线程使用一个状态。对于每个输出脚本,使用单个状态。请记住,规则重新加载临时文件会使状态要求加倍。