水平条形图
使用的seaborn组件: set_theme() , load_dataset() , set_color_codes() , barplot() , set_color_codes() , barplot() , despine()
import seaborn as sns
import matplotlib.pyplot as plt
sns.set_theme(style="whitegrid")
# Initialize the matplotlib figure
f, ax = plt.subplots(figsize=(6, 15))
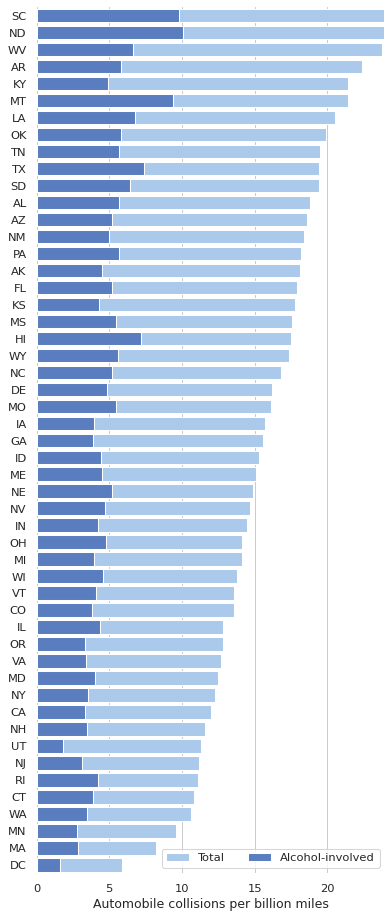
# Load the example car crash dataset
crashes = sns.load_dataset("car_crashes").sort_values("total", ascending=False)
# Plot the total crashes
sns.set_color_codes("pastel")
sns.barplot(x="total", y="abbrev", data=crashes,
label="Total", color="b")
# Plot the crashes where alcohol was involved
sns.set_color_codes("muted")
sns.barplot(x="alcohol", y="abbrev", data=crashes,
label="Alcohol-involved", color="b")
# Add a legend and informative axis label
ax.legend(ncol=2, loc="lower right", frameon=True)
ax.set(xlim=(0, 24), ylabel="",
xlabel="Automobile collisions per billion miles")
sns.despine(left=True, bottom=True)