分组条形图
使用的seaborn组件: set_theme() , load_dataset() , catplot()
import seaborn as sns
sns.set_theme(style="whitegrid")
penguins = sns.load_dataset("penguins")
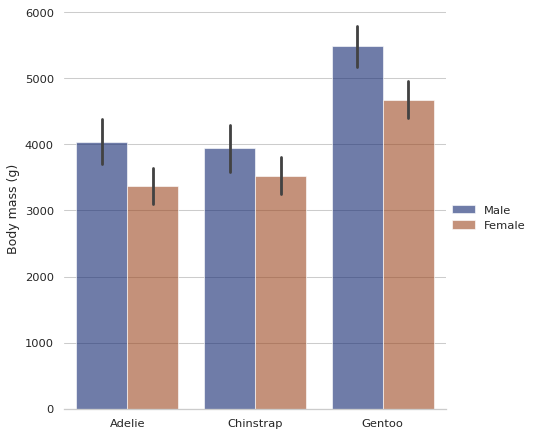
# Draw a nested barplot by species and sex
g = sns.catplot(
data=penguins, kind="bar",
x="species", y="body_mass_g", hue="sex",
ci="sd", palette="dark", alpha=.6, height=6
)
g.despine(left=True)
g.set_axis_labels("", "Body mass (g)")
g.legend.set_title("")