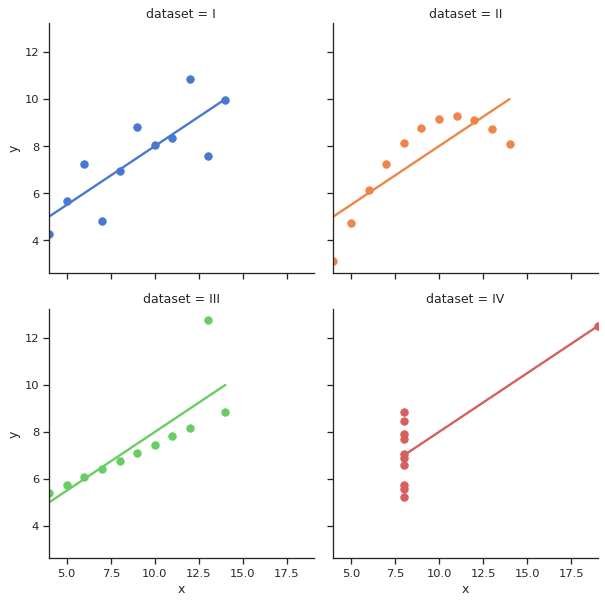
安斯科姆四重奏
使用的seaborn组件: set_theme() , load_dataset() , lmplot()
import seaborn as sns
sns.set_theme(style="ticks")

# Load the example dataset for Anscombe's quartet
df = sns.load_dataset("anscombe")

# Show the results of a linear regression within each dataset
sns.lmplot(x="x", y="y", col="dataset", hue="dataset", data=df,
           col_wrap=2, ci=None, palette="muted", height=4,
           scatter_kws={"s": 50, "alpha": 1})