 Source
备注
单击 here 下载完整的示例代码或通过活页夹在浏览器中运行此示例
基于RANSAC的稳健线性模型估计
在这个例子中,我们看到了如何使用RANSAC(随机样本一致性)算法将线模型稳健地匹配到错误数据。
首先,通过将高斯噪声添加到线性函数来生成数据。然后,将离群点添加到数据集中。
RANSAC迭代地估计数据集中的参数。在每次迭代中,将执行以下步骤:
选择
min_samples从原始数据中随机抽样并检查数据集是否有效(请参见is_data_valid选项)。估计随机子集上的模型 (
model_cls.estimate(*data[random_subset]),并检查估计模型是否有效(见is_model_valid选项)。通过使用估计模型计算残差,将所有数据点分类为内值点或异常值 (
model_cls.residuals(*data))-残差小于residual_threshold被认为是局内人。如果Inlier采样数比以往任何时候都多,请将估计的模型保存为最佳模型。如果当前估计模型具有相同的内点数目,则仅当残差和较低时,它才被认为是最好的模型。
这些步骤要么执行最大次数,要么直到满足特殊停止标准之一。使用先前确定的最佳模型的所有Inlier样本来估计最终模型。
import numpy as np
from matplotlib import pyplot as plt
from skimage.measure import LineModelND, ransac
np.random.seed(seed=1)
# generate coordinates of line
x = np.arange(-200, 200)
y = 0.2 * x + 20
data = np.column_stack([x, y])
# add gaussian noise to coordinates
noise = np.random.normal(size=data.shape)
data += 0.5 * noise
data[::2] += 5 * noise[::2]
data[::4] += 20 * noise[::4]
# add faulty data
faulty = np.array(30 * [(180., -100)])
faulty += 10 * np.random.normal(size=faulty.shape)
data[:faulty.shape[0]] = faulty
# fit line using all data
model = LineModelND()
model.estimate(data)
# robustly fit line only using inlier data with RANSAC algorithm
model_robust, inliers = ransac(data, LineModelND, min_samples=2,
residual_threshold=1, max_trials=1000)
outliers = inliers == False
# generate coordinates of estimated models
line_x = np.arange(-250, 250)
line_y = model.predict_y(line_x)
line_y_robust = model_robust.predict_y(line_x)
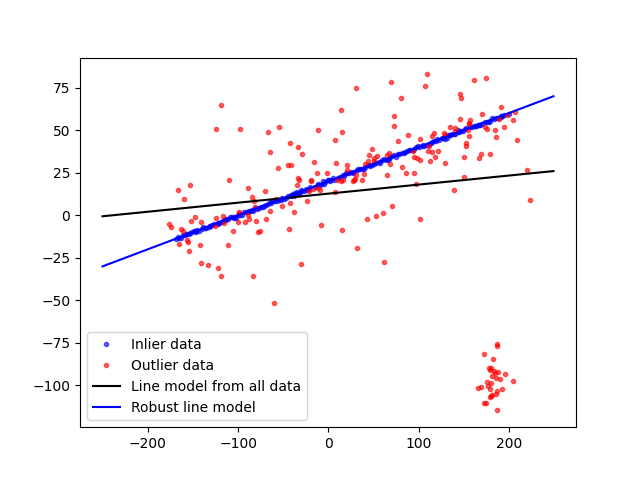
fig, ax = plt.subplots()
ax.plot(data[inliers, 0], data[inliers, 1], '.b', alpha=0.6,
label='Inlier data')
ax.plot(data[outliers, 0], data[outliers, 1], '.r', alpha=0.6,
label='Outlier data')
ax.plot(line_x, line_y, '-k', label='Line model from all data')
ax.plot(line_x, line_y_robust, '-b', label='Robust line model')
ax.legend(loc='lower left')
plt.show()
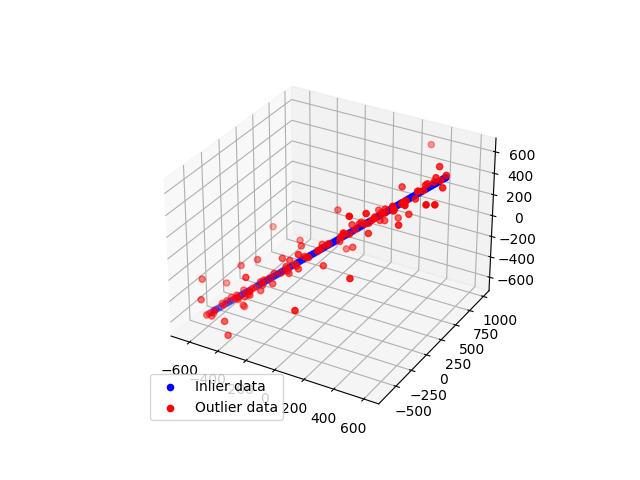
现在,我们将此示例推广到三维点。
import numpy as np
from matplotlib import pyplot as plt
from mpl_toolkits.mplot3d import Axes3D
from skimage.measure import LineModelND, ransac

np.random.seed(seed=1)

# generate coordinates of line
point = np.array([0, 0, 0], dtype='float')
direction = np.array([1, 1, 1], dtype='float') / np.sqrt(3)
xyz = point + 10 * np.arange(-100, 100)[..., np.newaxis] * direction

# add gaussian noise to coordinates
noise = np.random.normal(size=xyz.shape)
xyz += 0.5 * noise
xyz[::2] += 20 * noise[::2]
xyz[::4] += 100 * noise[::4]

# robustly fit line only using inlier data with RANSAC algorithm
model_robust, inliers = ransac(xyz, LineModelND, min_samples=2,
                               residual_threshold=1, max_trials=1000)
outliers = inliers == False

fig = plt.figure()
ax = fig.add_subplot(111, projection='3d')
ax.scatter(xyz[inliers][:, 0], xyz[inliers][:, 1], xyz[inliers][:, 2], c='b',
           marker='o', label='Inlier data')
ax.scatter(xyz[outliers][:, 0], xyz[outliers][:, 1], xyz[outliers][:, 2], c='r',
           marker='o', label='Outlier data')
ax.legend(loc='lower left')
plt.show()
脚本的总运行时间: (0分0.209秒)