 Source
备注
单击 here 下载完整的示例代码或通过活页夹在浏览器中运行此示例
度量区域属性
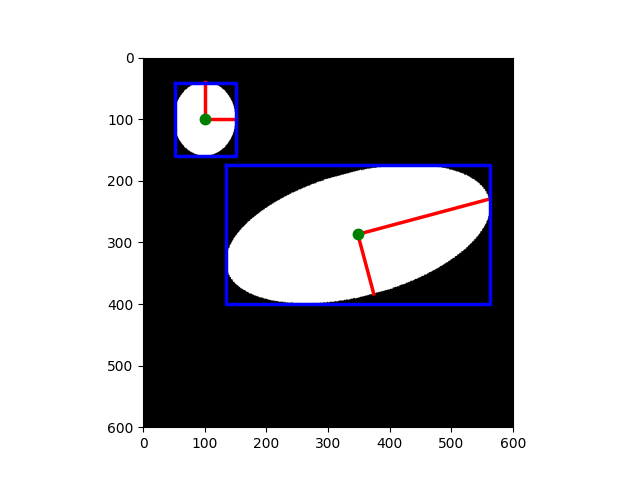
此示例说明如何测量带标签的图像区域的属性。我们首先分析一个带有两个椭圆的图像。下面我们将展示如何交互地探索带标签的对象的属性。
import math
import matplotlib.pyplot as plt
import numpy as np
import pandas as pd

from skimage.draw import ellipse
from skimage.measure import label, regionprops, regionprops_table
from skimage.transform import rotate


image = np.zeros((600, 600))

rr, cc = ellipse(300, 350, 100, 220)
image[rr, cc] = 1

image = rotate(image, angle=15, order=0)

rr, cc = ellipse(100, 100, 60, 50)
image[rr, cc] = 1

label_img = label(image)
regions = regionprops(label_img)
我们使用 skimage.measure.regionprops() 结果在每个区域上绘制某些属性。例如,在红色中,我们绘制每个椭圆的长轴和短轴。
fig, ax = plt.subplots()
ax.imshow(image, cmap=plt.cm.gray)

for props in regions:
    y0, x0 = props.centroid
    orientation = props.orientation
    x1 = x0 + math.cos(orientation) * 0.5 * props.minor_axis_length
    y1 = y0 - math.sin(orientation) * 0.5 * props.minor_axis_length
    x2 = x0 - math.sin(orientation) * 0.5 * props.major_axis_length
    y2 = y0 - math.cos(orientation) * 0.5 * props.major_axis_length

    ax.plot((x0, x1), (y0, y1), '-r', linewidth=2.5)
    ax.plot((x0, x2), (y0, y2), '-r', linewidth=2.5)
    ax.plot(x0, y0, '.g', markersize=15)

    minr, minc, maxr, maxc = props.bbox
    bx = (minc, maxc, maxc, minc, minc)
    by = (minr, minr, maxr, maxr, minr)
    ax.plot(bx, by, '-b', linewidth=2.5)

ax.axis((0, 600, 600, 0))
plt.show()
我们使用 skimage.measure.regionprops_table() 计算每个区域的(选定)属性。请注意 skimage.measure.regionprops_table 实际计算属性,而 skimage.measure.regionprops 在使用它们时计算它们(懒惰评估)。
props = regionprops_table(label_img, properties=('centroid',
                                                 'orientation',
                                                 'major_axis_length',
                                                 'minor_axis_length'))
我们现在显示这些选定属性的表(每行一个区域), skimage.measure.regionprops_table 结果是一个与熊猫兼容的判决。
pd.DataFrame(props)
还可以通过在标签的悬停信息中可视化标记的对象的属性来交互地探索它们的属性。本例使用PLOTLY以便在将鼠标悬停在对象上时显示特性。
import plotly.express as px
import plotly.graph_objects as go
from skimage import data, filters, measure, morphology

img = data.coins()
# Binary image, post-process the binary mask and compute labels
threshold = filters.threshold_otsu(img)
mask = img > threshold
mask = morphology.remove_small_objects(mask, 50)
mask = morphology.remove_small_holes(mask, 50)
labels = measure.label(mask)

fig = px.imshow(img, binary_string=True)
fig.update_traces(hoverinfo='skip') # hover is only for label info

props = measure.regionprops(labels, img)
properties = ['area', 'eccentricity', 'perimeter', 'mean_intensity']

# For each label, add a filled scatter trace for its contour,
# and display the properties of the label in the hover of this trace.
for index in range(1, labels.max()):
    label = props[index].label
    contour = measure.find_contours(labels == label, 0.5)[0]
    y, x = contour.T
    hoverinfo = ''
    for prop_name in properties:
        hoverinfo += f'<b>{prop_name}: {getattr(props[index], prop_name):.2f}</b><br>'
    fig.add_trace(go.Scatter(
        x=x, y=y, name=label,
        mode='lines', fill='toself', showlegend=False,
        hovertemplate=hoverinfo, hoveron='points+fills'))

fig
脚本的总运行时间: (0分0.264秒)