 Source
备注
单击 here 下载完整的示例代码或通过活页夹在浏览器中运行此示例
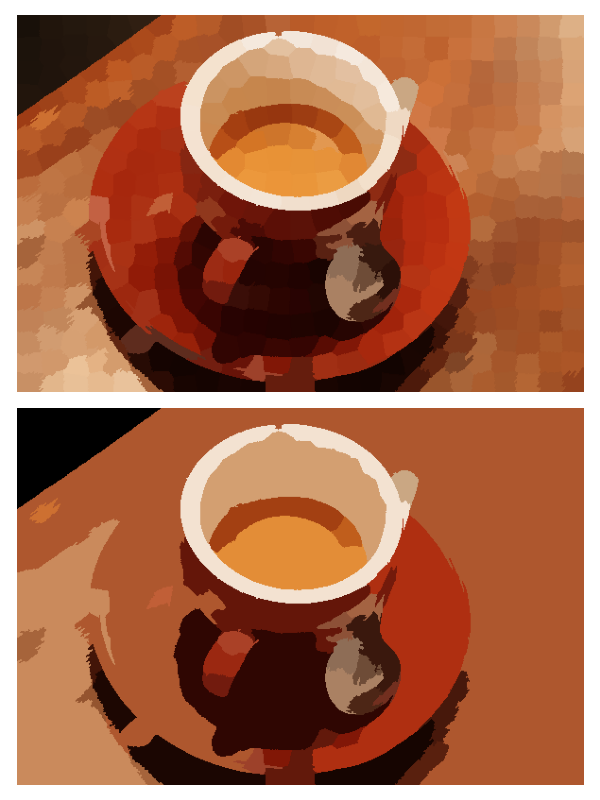
RAG阈值
此示例构建一个区域邻接图(RAG),并合并颜色相似的区域。我们构造了一块碎布,并将边缘定义为平均颜色的差异。然后我们连接具有相似平均颜色的区域。
from skimage import data, segmentation, color
from skimage.future import graph
from matplotlib import pyplot as plt


img = data.coffee()

labels1 = segmentation.slic(img, compactness=30, n_segments=400, start_label=1)
out1 = color.label2rgb(labels1, img, kind='avg', bg_label=0)

g = graph.rag_mean_color(img, labels1)
labels2 = graph.cut_threshold(labels1, g, 29)
out2 = color.label2rgb(labels2, img, kind='avg', bg_label=0)

fig, ax = plt.subplots(nrows=2, sharex=True, sharey=True,
                       figsize=(6, 8))

ax[0].imshow(out1)
ax[1].imshow(out2)

for a in ax:
    a.axis('off')

plt.tight_layout()
脚本的总运行时间: (0分1.996秒)