 Source
备注
单击 here 下载完整的示例代码或通过活页夹在浏览器中运行此示例
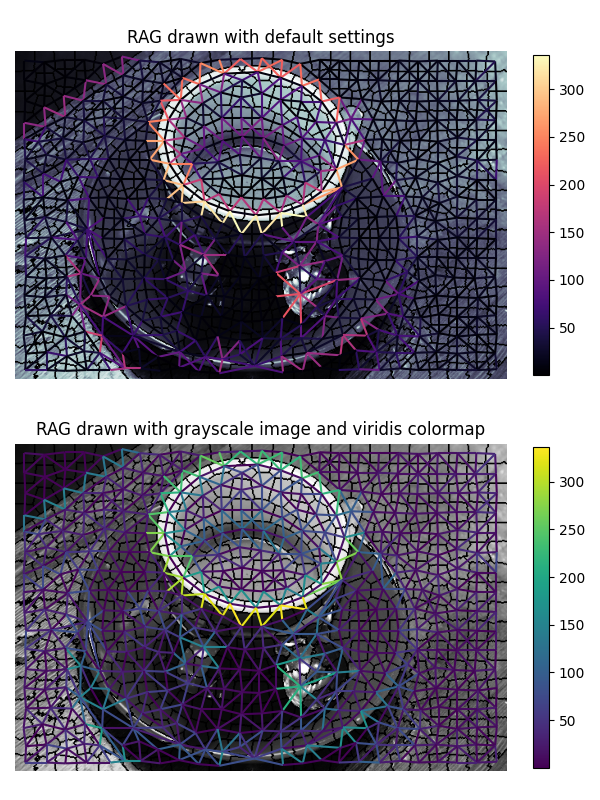
绘制区域邻接图(RAG)
此示例构造一个区域邻接图(RAG),并使用 rag_draw 方法。
from skimage import data, segmentation
from skimage.future import graph
from matplotlib import pyplot as plt


img = data.coffee()
labels = segmentation.slic(img, compactness=30, n_segments=400, start_label=1)
g = graph.rag_mean_color(img, labels)

fig, ax = plt.subplots(nrows=2, sharex=True, sharey=True, figsize=(6, 8))

ax[0].set_title('RAG drawn with default settings')
lc = graph.show_rag(labels, g, img, ax=ax[0])
# specify the fraction of the plot area that will be used to draw the colorbar
fig.colorbar(lc, fraction=0.03, ax=ax[0])

ax[1].set_title('RAG drawn with grayscale image and viridis colormap')
lc = graph.show_rag(labels, g, img,
                    img_cmap='gray', edge_cmap='viridis', ax=ax[1])
fig.colorbar(lc, fraction=0.03, ax=ax[1])

for a in ax:
    a.axis('off')

plt.tight_layout()
plt.show()
脚本的总运行时间: (0分1.926秒)