 Source
备注
单击 here 下载完整的示例代码或通过活页夹在浏览器中运行此示例
区域邻接图
此示例演示如何使用 merge_nodes 区域邻接图(RAG)的函数。这个 RAG 类表示一个无向加权图,该图从 networkx.graph 班级。当通过合并两个结点形成新结点时,可以通过用户定义的函数来更新与结果结点关联的所有边的边权重 weight_func 。
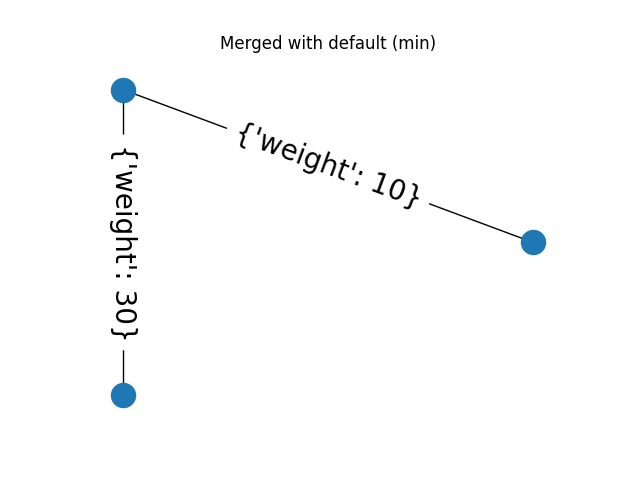
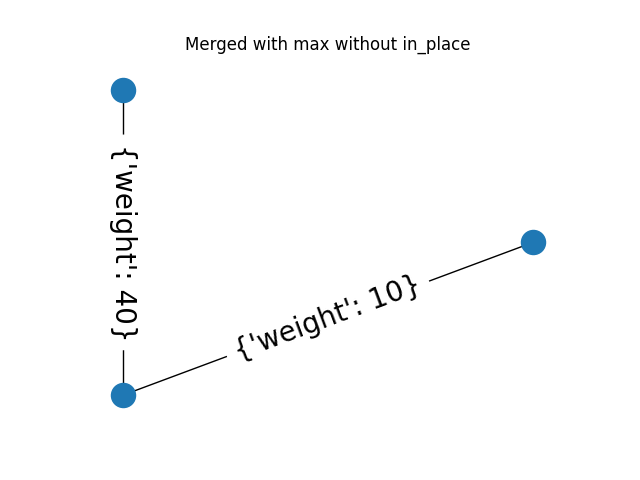
默认行为是在发生冲突时使用较小的边权重。下面的例子还展示了如何使用自定义函数来选择较大的权重。

from skimage.future.graph import rag
import networkx as nx
from matplotlib import pyplot as plt
import numpy as np


def max_edge(g, src, dst, n):
    """Callback to handle merging nodes by choosing maximum weight.

    Returns a dictionary with `"weight"` set as either the weight between
    (`src`, `n`) or (`dst`, `n`) in `g` or the maximum of the two when
    both exist.

    Parameters
    ----------
    g : RAG
        The graph under consideration.
    src, dst : int
        The vertices in `g` to be merged.
    n : int
        A neighbor of `src` or `dst` or both.

    Returns
    -------
    data : dict
        A dict with the "weight" attribute set the weight between
        (`src`, `n`) or (`dst`, `n`) in `g` or the maximum of the two when
        both exist.
    """

    w1 = g[n].get(src, {'weight': -np.inf})['weight']
    w2 = g[n].get(dst, {'weight': -np.inf})['weight']
    return {'weight': max(w1, w2)}


def display(g, title):
    """Displays a graph with the given title."""
    pos = nx.circular_layout(g)
    plt.figure()
    plt.title(title)
    nx.draw(g, pos)
    nx.draw_networkx_edge_labels(g, pos, font_size=20)


g = rag.RAG()
g.add_edge(1, 2, weight=10)
g.add_edge(2, 3, weight=20)
g.add_edge(3, 4, weight=30)
g.add_edge(4, 1, weight=40)
g.add_edge(1, 3, weight=50)

# Assigning dummy labels.
for n in g.nodes():
    g.nodes[n]['labels'] = [n]

gc = g.copy()

display(g, "Original Graph")

g.merge_nodes(1, 3)
display(g, "Merged with default (min)")

gc.merge_nodes(1, 3, weight_func=max_edge, in_place=False)
display(gc, "Merged with max without in_place")

plt.show()
脚本的总运行时间: (0分0.153秒)