 Source
备注
单击 here 下载完整的示例代码或通过活页夹在浏览器中运行此示例
多大津阈值
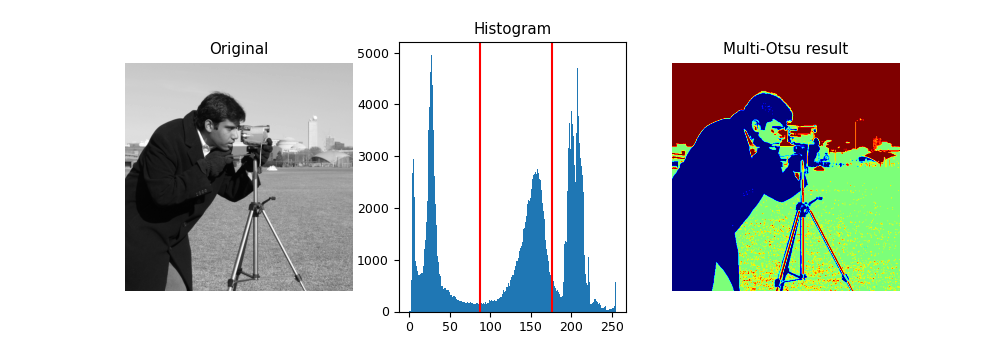
多重大津阈值 1 是一种阈值算法,用于将输入图像的像素分成几个不同的类别,每个类别根据图像中灰度级的强度获得。
多OTSU计算由所需类的数量确定的几个阈值。默认的类数是3:对于获得三个类,算法返回两个阈值。它们在下面的直方图中用一条红线表示。
- 1
廖培生、陈天山、陈天山。钟宝强,“一种多阈值的快速算法”,“信息科学与工程杂志”,17(5):713-727,2001。可在以下网址获得:<https://ftp.iis.sinica.edu.tw/JISE/2001/200109_01.pdf>.
import matplotlib
import matplotlib.pyplot as plt
import numpy as np

from skimage import data
from skimage.filters import threshold_multiotsu

# Setting the font size for all plots.
matplotlib.rcParams['font.size'] = 9

# The input image.
image = data.camera()

# Applying multi-Otsu threshold for the default value, generating
# three classes.
thresholds = threshold_multiotsu(image)

# Using the threshold values, we generate the three regions.
regions = np.digitize(image, bins=thresholds)

fig, ax = plt.subplots(nrows=1, ncols=3, figsize=(10, 3.5))

# Plotting the original image.
ax[0].imshow(image, cmap='gray')
ax[0].set_title('Original')
ax[0].axis('off')

# Plotting the histogram and the two thresholds obtained from
# multi-Otsu.
ax[1].hist(image.ravel(), bins=255)
ax[1].set_title('Histogram')
for thresh in thresholds:
    ax[1].axvline(thresh, color='r')

# Plotting the Multi Otsu result.
ax[2].imshow(regions, cmap='jet')
ax[2].set_title('Multi-Otsu result')
ax[2].axis('off')

plt.subplots_adjust()

plt.show()
脚本的总运行时间: (0分0.314秒)