 Source
备注
单击 here 下载完整的示例代码或通过活页夹在浏览器中运行此示例
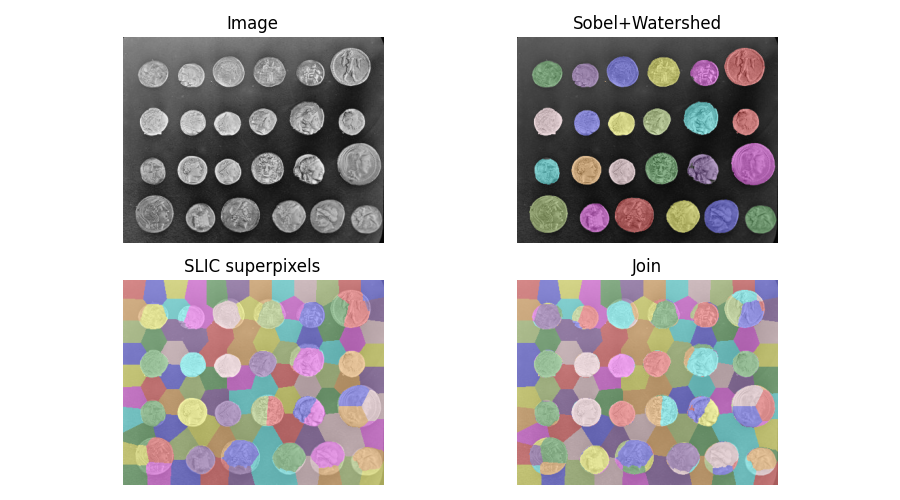
找出两个分段的交点
分割图像时,您可能希望合并多个备选分割。这个 skimage.segmentation.join_segmentations() 函数计算两个分段的联接,在这两个分段中,当且仅当像素位于 both 分段。
输出:
/vpy/lib/python3.9/site-packages/scikit_image-0.20.0.dev0-py3.9-linux-x86_64.egg/skimage/_shared/utils.py:338: FutureWarning:

`multichannel` is a deprecated argument name for `slic`. It will be removed in version 1.0. Please use `channel_axis` instead.

/scikit-image/doc/examples/segmentation/plot_join_segmentations.py:38: FutureWarning:

`max_iter` is a deprecated argument name for `slic`. It will be removed in version 1.0. Please use `max_num_iter` instead.
import numpy as np
import matplotlib.pyplot as plt

from skimage.filters import sobel
from skimage.measure import label
from skimage.segmentation import slic, join_segmentations, watershed
from skimage.color import label2rgb
from skimage import data

coins = data.coins()

# Make segmentation using edge-detection and watershed.
edges = sobel(coins)

# Identify some background and foreground pixels from the intensity values.
# These pixels are used as seeds for watershed.
markers = np.zeros_like(coins)
foreground, background = 1, 2
markers[coins < 30.0] = background
markers[coins > 150.0] = foreground

ws = watershed(edges, markers)
seg1 = label(ws == foreground)

# Make segmentation using SLIC superpixels.
seg2 = slic(coins, n_segments=117, max_iter=160, sigma=1, compactness=0.75,
            multichannel=False, start_label=0)

# Combine the two.
segj = join_segmentations(seg1, seg2)

# Show the segmentations.
fig, axes = plt.subplots(ncols=2, nrows=2, figsize=(9, 5),
                         sharex=True, sharey=True)
ax = axes.ravel()
ax[0].imshow(coins, cmap='gray')
ax[0].set_title('Image')

color1 = label2rgb(seg1, image=coins, bg_label=0)
ax[1].imshow(color1)
ax[1].set_title('Sobel+Watershed')

color2 = label2rgb(seg2, image=coins, image_alpha=0.5, bg_label=-1)
ax[2].imshow(color2)
ax[2].set_title('SLIC superpixels')

color3 = label2rgb(segj, image=coins, image_alpha=0.5, bg_label=-1)
ax[3].imshow(color3)
ax[3].set_title('Join')

for a in ax:
    a.axis('off')
fig.tight_layout()
plt.show()
脚本的总运行时间: (0分1.124秒)