 Source
备注
单击 here 下载完整的示例代码或通过活页夹在浏览器中运行此示例
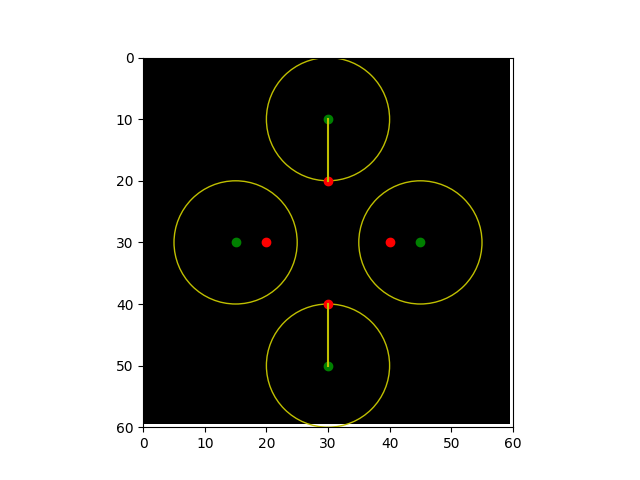
Hausdorff距离
此示例说明如何计算两组点之间的Hausdorff距离。这个 Hausdorff distance 是第一个集合上的任意点与第二个集合上的最近点之间的最大距离,反之亦然。
import matplotlib.pyplot as plt
import numpy as np

from skimage import metrics

shape = (60, 60)
image = np.zeros(shape)

# Create a diamond-like shape where the four corners form the 1st set of points
x_diamond = 30
y_diamond = 30
r = 10

fig, ax = plt.subplots()
plt_x = [0, 1, 0, -1]
plt_y = [1, 0, -1, 0]

set_ax = [(x_diamond + r * x) for x in plt_x]
set_ay = [(y_diamond + r * y) for y in plt_y]
plt.plot(set_ax, set_ay, 'or')

# Create a kite-like shape where the four corners form the 2nd set of points
x_kite = 30
y_kite = 30
x_r = 15
y_r = 20

set_bx = [(x_kite + x_r * x) for x in plt_x]
set_by = [(y_kite + y_r * y) for y in plt_y]
plt.plot(set_bx, set_by, 'og')

# Set up the data to compute the hausdorff distance
coords_a = np.zeros(shape, dtype=bool)
coords_b = np.zeros(shape, dtype=bool)
for x, y in zip(set_ax, set_ay):
    coords_a[(x, y)] = True

for x, y in zip(set_bx, set_by):
    coords_b[(x, y)] = True

# Call the hausdorff function on the coordinates
metrics.hausdorff_distance(coords_a, coords_b)

# Plot the lines that shows the length of the hausdorff distance
x_line = [30, 30]
y_line = [20, 10]
plt.plot(x_line, y_line, 'y')

x_line = [30, 30]
y_line = [40, 50]
plt.plot(x_line, y_line, 'y')

# Plot circles to show that at this distance, the hausdorff distance can
# travel to its nearest neighbor (in this case, from the kite to diamond)
ax.add_artist(plt.Circle((30, 10), 10, color='y', fill=None))
ax.add_artist(plt.Circle((30, 50), 10, color='y', fill=None))
ax.add_artist(plt.Circle((15, 30), 10, color='y', fill=None))
ax.add_artist(plt.Circle((45, 30), 10, color='y', fill=None))

ax.imshow(image, cmap=plt.cm.gray)
ax.axis((0, 60, 60, 0))
plt.show()
脚本的总运行时间: (0分0.065秒)