 Source
备注
单击 here 下载完整的示例代码或通过活页夹在浏览器中运行此示例
欧拉数
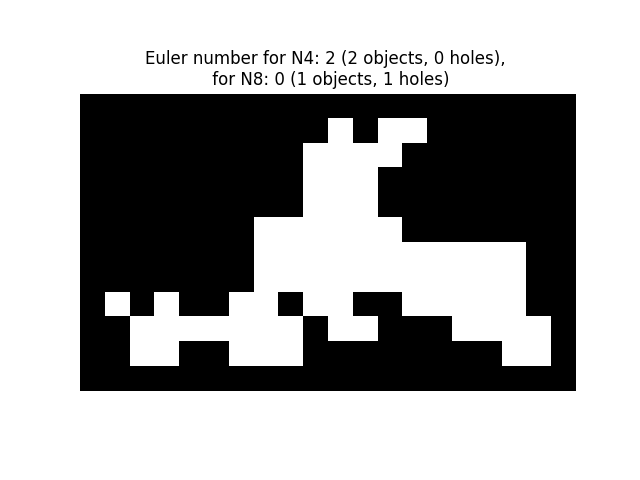
此示例显示了欧拉数的计算示例 1 在2D和3D对象中。
对于二维对象,欧拉数等于对象数减去孔数。请注意,如果考虑对象的8个连通像素的邻域(2-连通性),则这相当于考虑互补集合(洞、背景)的4个连通像素的邻域(1-连通性),反之亦然。还可以使用以下命令计算对象的数量 skimage.measure.label() ,并从这两个数字之间的差值推算出孔数。
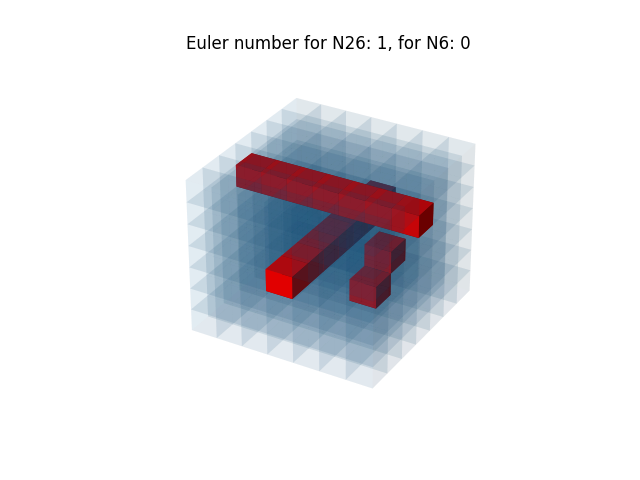
对于三维对象,欧拉数等于对象数加上孔数减去隧道或环路数。如果对对象使用3连通性(将周围的26个体素视为其邻域),这对应于对互补集(洞、背景)使用1连通性,即仅考虑给定体素的6个邻域。体素在这里用蓝色透明曲面表示。内部疏松用红色表示。
from mpl_toolkits.mplot3d import Axes3D
from skimage.measure import euler_number, label
import matplotlib.pyplot as plt
import numpy as np


# Sample image.
SAMPLE = np.array(
    [[0, 0, 0, 0, 0, 0, 0, 0, 0, 1, 0, 1, 1, 0, 0, 0, 0, 0],
     [0, 0, 0, 0, 0, 0, 0, 0, 1, 1, 1, 1, 0, 0, 0, 0, 0, 0],
     [0, 0, 0, 0, 0, 0, 0, 0, 1, 1, 1, 0, 0, 0, 0, 0, 0, 0],
     [0, 0, 0, 0, 0, 0, 0, 0, 1, 1, 1, 0, 0, 0, 0, 0, 0, 0],
     [0, 0, 0, 0, 0, 0, 1, 1, 1, 1, 1, 1, 0, 0, 0, 0, 0, 0],
     [0, 0, 0, 0, 0, 0, 1, 1, 1, 1, 1, 1, 1, 1, 1, 1, 1, 0],
     [0, 0, 0, 0, 0, 0, 1, 1, 1, 1, 1, 1, 1, 1, 1, 1, 1, 0],
     [1, 0, 1, 0, 0, 1, 1, 0, 1, 1, 0, 0, 1, 1, 1, 1, 1, 0],
     [0, 1, 1, 1, 1, 1, 1, 1, 0, 1, 1, 0, 0, 0, 1, 1, 1, 1],
     [0, 1, 1, 0, 0, 1, 1, 1, 0, 0, 0, 0, 0, 0, 0, 0, 1, 1]]
)
SAMPLE = np.pad(SAMPLE, 1, mode='constant')

fig, ax = plt.subplots()
ax.imshow(SAMPLE, cmap=plt.cm.gray)
ax.axis('off')
e4 = euler_number(SAMPLE, connectivity=1)
object_nb_4 = label(SAMPLE, connectivity=1).max()
holes_nb_4 = object_nb_4 - e4
e8 = euler_number(SAMPLE, connectivity=2)
object_nb_8 = label(SAMPLE, connectivity=2).max()
holes_nb_8 = object_nb_8 - e8
ax.set_title('Euler number for N4: {} ({} objects, {} holes), \n for N8: {} ({} objects, {} holes)'.format(e4, object_nb_4, holes_nb_4, e8, object_nb_8, holes_nb_8))
plt.show()
3-D对象
在本例中,生成了一个3-D立方体,然后添加了孔和隧道。欧拉数是用6和26的邻居配置来计算的。此代码受https://matplotlib.org/devdocs/gallery/mplot3d/voxels_numpy_logo.html启发
def make_ax(grid=False):
    fig = plt.figure()
    ax = fig.gca(projection='3d')
    ax.grid(grid)
    ax.set_axis_off()
    return ax


def explode(data):
    """visualization to separate voxels

    Data voxels are separated by 0-valued ones so that they appear
    separated in the matplotlib figure.
    """
    size = np.array(data.shape) * 2
    data_e = np.zeros(size - 1, dtype=data.dtype)
    data_e[::2, ::2, ::2] = data
    return data_e

# shrink the gaps between voxels


def expand_coordinates(indices):
    """
    This collapses together pairs of indices, so that
    the gaps in the volume array will have a zero width.
    """
    x, y, z = indices
    x[1::2, :, :] += 1
    y[:, 1::2, :] += 1
    z[:, :, 1::2] += 1
    return x, y, z


def display_voxels(volume):
    """
    volume: (N,M,P) array
            Represents a binary set of pixels: objects are marked with 1,
            complementary (porosities) with 0.

    The voxels are actually represented with blue transparent surfaces.
    Inner porosities are represented in red.
    """

    # define colors
    red = '#ff0000ff'
    blue = '#1f77b410'

    # upscale the above voxel image, leaving gaps
    filled = explode(np.ones(volume.shape))

    fcolors = explode(np.where(volume, blue, red))

    # Shrink the gaps
    x, y, z = expand_coordinates(np.indices(np.array(filled.shape) + 1))

    # Define 3D figure and place voxels
    ax = make_ax()
    ax.voxels(x, y, z, filled, facecolors=fcolors)
    # Compute Euler number in 6 and 26 neighbourhood configuration, that
    # correspond to 1 and 3 connectivity, respectively
    e26 = euler_number(volume, connectivity=3)
    e6 = euler_number(volume, connectivity=1)
    plt.title('Euler number for N26: {}, for N6: {}'.format(e26, e6))
    plt.show()


# Define a volume of 7x7x7 voxels
n = 7
cube = np.ones((n, n, n), dtype=bool)
# Add a tunnel
c = int(n/2)
cube[c, :, c] = False
# Add a new hole
cube[int(3*n/4), c-1, c-1] = False
# Add a hole in neighbourhood of previous one
cube[int(3*n/4), c, c] = False
# Add a second tunnel
cube[:, c, int(3*n/4)] = False
display_voxels(cube)
输出:
/scikit-image/doc/examples/segmentation/plot_euler_number.py:72: MatplotlibDeprecationWarning:

Calling gca() with keyword arguments was deprecated in Matplotlib 3.4. Starting two minor releases later, gca() will take no keyword arguments. The gca() function should only be used to get the current axes, or if no axes exist, create new axes with default keyword arguments. To create a new axes with non-default arguments, use plt.axes() or plt.subplot().
脚本的总运行时间: (0分0.611秒)