 Source
备注
单击 here 下载完整的示例代码或通过活页夹在浏览器中运行此示例
图像/阵列上的数据块视图
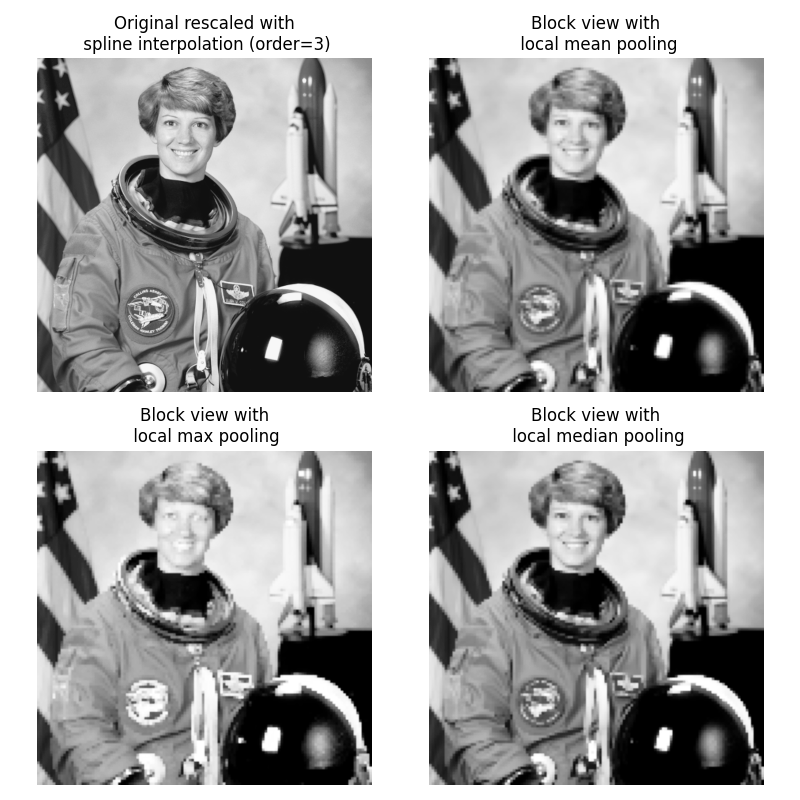
此示例说明如何使用 view_as_blocks 从… skimage.util() 。当一个人想要在非重叠的图像块上执行本地操作时,块视图可以非常有用。
我们使用 astronaut 从… skimage.data 然后把它虚拟地“切”成方块。然后,在每个块上,我们将该块的平均值、最大值或中值汇集在一起。结果将与原始结果的3阶样条插值法一起显示出来 astronaut 图像。
import numpy as np
from scipy import ndimage as ndi
from matplotlib import pyplot as plt
import matplotlib.cm as cm

from skimage import data
from skimage import color
from skimage.util import view_as_blocks


# get astronaut from skimage.data in grayscale
l = color.rgb2gray(data.astronaut())

# size of blocks
block_shape = (4, 4)

# see astronaut as a matrix of blocks (of shape block_shape)
view = view_as_blocks(l, block_shape)

# collapse the last two dimensions in one
flatten_view = view.reshape(view.shape[0], view.shape[1], -1)

# resampling the image by taking either the `mean`,
# the `max` or the `median` value of each blocks.
mean_view = np.mean(flatten_view, axis=2)
max_view = np.max(flatten_view, axis=2)
median_view = np.median(flatten_view, axis=2)

# display resampled images
fig, axes = plt.subplots(2, 2, figsize=(8, 8), sharex=True, sharey=True)
ax = axes.ravel()

l_resized = ndi.zoom(l, 2, order=3)
ax[0].set_title("Original rescaled with\n spline interpolation (order=3)")
ax[0].imshow(l_resized, extent=(-0.5, 128.5, 128.5, -0.5),
             cmap=cm.Greys_r)

ax[1].set_title("Block view with\n local mean pooling")
ax[1].imshow(mean_view, cmap=cm.Greys_r)

ax[2].set_title("Block view with\n local max pooling")
ax[2].imshow(max_view, cmap=cm.Greys_r)

ax[3].set_title("Block view with\n local median pooling")
ax[3].imshow(median_view, cmap=cm.Greys_r)

for a in ax:
    a.set_axis_off()

fig.tight_layout()
plt.show()
脚本的总运行时间: (0分0.381秒)