 Source
备注
单击 here 下载完整的示例代码或通过活页夹在浏览器中运行此示例
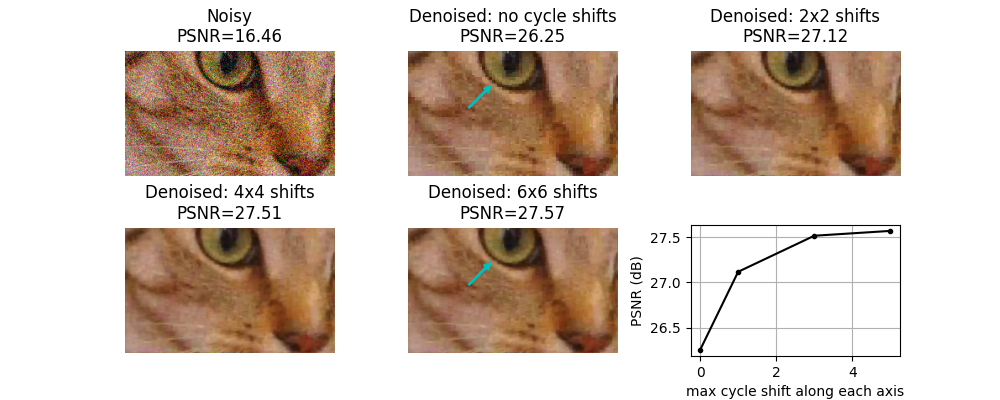
平移不变的小波去噪
离散小波变换不是 shift-invariant 。移位不变性可以通过非抽取小波变换(也称为平稳小波变换)来实现,但代价是增加了冗余度(即,比输入图像像素更多的小波系数)。在利用离散小波变换进行图像去噪的背景下,近似平移不变性的另一种方法是使用被称为“循环旋转”的技术。这涉及对多个空间移位的以下3步过程的结果求平均,n:
(循环地)将信号移位一个量,n
应用去噪
应用逆移位
对于2D图像去噪,我们在这里证明了这种循环旋转可以提供实质性的质量提高,其中大部分增益只通过对每个轴上仅n=0和n=1的移位进行平均来实现。
输出:
/scikit-image/doc/examples/filters/plot_cycle_spinning.py:60: FutureWarning:

`multichannel` is a deprecated argument name for `cycle_spin`. It will be removed in version 1.0. Please use `channel_axis` instead.

/vpy/lib/python3.9/site-packages/scikit_image-0.20.0.dev0-py3.9-linux-x86_64.egg/skimage/restoration/_cycle_spin.py:136: FutureWarning:

`multichannel` is a deprecated argument name for `denoise_wavelet`. It will be removed in version 1.0. Please use `channel_axis` instead.

Clipping input data to the valid range for imshow with RGB data ([0..1] for floats or [0..255] for integers).
import matplotlib.pyplot as plt

from skimage.restoration import denoise_wavelet, cycle_spin
from skimage import data, img_as_float
from skimage.util import random_noise
from skimage.metrics import peak_signal_noise_ratio


original = img_as_float(data.chelsea()[100:250, 50:300])

sigma = 0.155
noisy = random_noise(original, var=sigma**2)

fig, ax = plt.subplots(nrows=2, ncols=3, figsize=(10, 4),
                       sharex=False, sharey=False)
ax = ax.ravel()

psnr_noisy = peak_signal_noise_ratio(original, noisy)
ax[0].imshow(noisy)
ax[0].axis('off')
ax[0].set_title('Noisy\nPSNR={:0.4g}'.format(psnr_noisy))


# Repeat denosing with different amounts of cycle spinning.  e.g.
# max_shift = 0 -> no cycle spinning
# max_shift = 1 -> shifts of (0, 1) along each axis
# max_shift = 3 -> shifts of (0, 1, 2, 3) along each axis
# etc...

denoise_kwargs = dict(multichannel=True, convert2ycbcr=True, wavelet='db1',
                      rescale_sigma=True)

all_psnr = []
max_shifts = [0, 1, 3, 5]
for n, s in enumerate(max_shifts):
    im_bayescs = cycle_spin(noisy, func=denoise_wavelet, max_shifts=s,
                            func_kw=denoise_kwargs, multichannel=True)
    ax[n+1].imshow(im_bayescs)
    ax[n+1].axis('off')
    psnr = peak_signal_noise_ratio(original, im_bayescs)
    if s == 0:
        ax[n+1].set_title(
            "Denoised: no cycle shifts\nPSNR={:0.4g}".format(psnr))
    else:
        ax[n+1].set_title(
            "Denoised: {0}x{0} shifts\nPSNR={1:0.4g}".format(s+1, psnr))
    all_psnr.append(psnr)

# plot PSNR as a function of the degree of cycle shifting
ax[5].plot(max_shifts, all_psnr, 'k.-')
ax[5].set_ylabel('PSNR (dB)')
ax[5].set_xlabel('max cycle shift along each axis')
ax[5].grid(True)
plt.subplots_adjust(wspace=0.35, hspace=0.35)

# Annotate with a cyan arrow on the 6x6 case vs. no cycle shift case to
# illustrate a region with reduced block-like artifact with cycle shifting
arrowprops = dict(arrowstyle="simple,tail_width=0.1,head_width=0.5",
                  connectionstyle="arc3",
                  color='c')
for i in [1, 4]:
    ax[i].annotate("", xy=(101, 39), xycoords='data',
                   xytext=(70, 70), textcoords='data',
                   arrowprops=arrowprops)

plt.show()
脚本的总运行时间: (0分0.959秒)