 Source
备注
单击 here 下载完整的示例代码或通过活页夹在浏览器中运行此示例
RGB到HSV
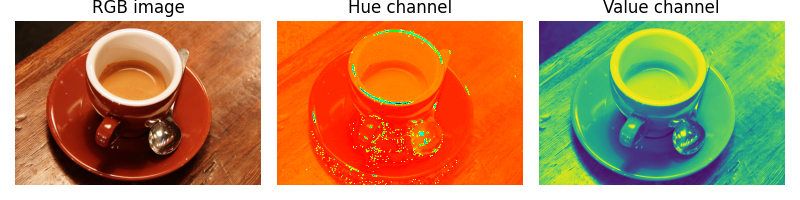
此示例说明如何将RGB转换为HSV(色调、饱和度、值 1 可用于促进分割过程。
通常,图像中的对象具有不同的颜色(色调)和亮度,因此这些特征可用于区分图像的不同区域。在RGB表示中,色调和亮度表示为R、G、B通道的线性组合,而它们对应于HSV图像的单个通道(色调和值通道)。然后,仅通过HSV通道的阈值就可以有效地执行图像的简单分割。
import matplotlib.pyplot as plt

from skimage import data
from skimage.color import rgb2hsv
我们首先加载RGB图像并提取色调和值通道:
rgb_img = data.coffee()
hsv_img = rgb2hsv(rgb_img)
hue_img = hsv_img[:, :, 0]
value_img = hsv_img[:, :, 2]

fig, (ax0, ax1, ax2) = plt.subplots(ncols=3, figsize=(8, 2))

ax0.imshow(rgb_img)
ax0.set_title("RGB image")
ax0.axis('off')
ax1.imshow(hue_img, cmap='hsv')
ax1.set_title("Hue channel")
ax1.axis('off')
ax2.imshow(value_img)
ax2.set_title("Value channel")
ax2.axis('off')

fig.tight_layout()
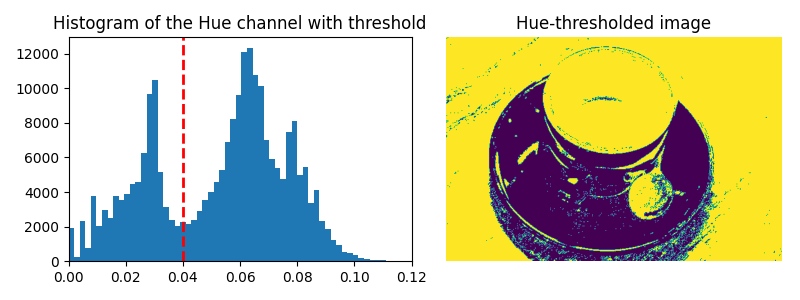
然后,我们在色调通道上设置一个阈值,以将杯子与背景分开:
hue_threshold = 0.04
binary_img = hue_img > hue_threshold

fig, (ax0, ax1) = plt.subplots(ncols=2, figsize=(8, 3))

ax0.hist(hue_img.ravel(), 512)
ax0.set_title("Histogram of the Hue channel with threshold")
ax0.axvline(x=hue_threshold, color='r', linestyle='dashed', linewidth=2)
ax0.set_xbound(0, 0.12)
ax1.imshow(binary_img)
ax1.set_title("Hue-thresholded image")
ax1.axis('off')

fig.tight_layout()
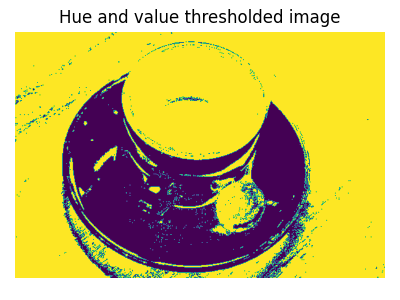
最后,我们对Value通道执行额外的阈值处理,以部分去除杯子的阴影:
fig, ax0 = plt.subplots(figsize=(4, 3))

value_threshold = 0.10
binary_img = (hue_img > hue_threshold) | (value_img < value_threshold)

ax0.imshow(binary_img)
ax0.set_title("Hue and value thresholded image")
ax0.axis('off')

fig.tight_layout()
plt.show()
脚本的总运行时间: (0分0.732秒)