 Source
备注
单击 here 下载完整的示例代码或通过活页夹在浏览器中运行此示例
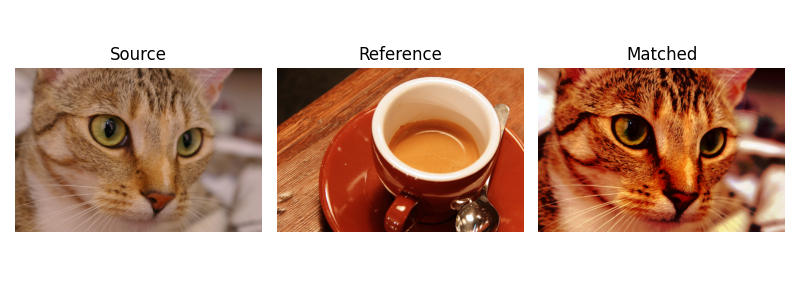
直方图匹配
这个例子演示了直方图匹配的功能。它处理输入图像的像素,使其直方图与参考图像的直方图匹配。如果图像具有多个通道,则只要输入图像和参考中的通道数目相等,就可以为每个通道独立完成匹配。
直方图匹配可以用作图像处理的轻量级归一化,例如特征匹配,特别是在图像是从不同来源或在不同条件下(即照明)获取的情况下。
import matplotlib.pyplot as plt

from skimage import data
from skimage import exposure
from skimage.exposure import match_histograms

reference = data.coffee()
image = data.chelsea()

matched = match_histograms(image, reference, multichannel=True)

fig, (ax1, ax2, ax3) = plt.subplots(nrows=1, ncols=3, figsize=(8, 3),
                                    sharex=True, sharey=True)
for aa in (ax1, ax2, ax3):
    aa.set_axis_off()

ax1.imshow(image)
ax1.set_title('Source')
ax2.imshow(reference)
ax2.set_title('Reference')
ax3.imshow(matched)
ax3.set_title('Matched')

plt.tight_layout()
plt.show()
输出:
/scikit-image/doc/examples/color_exposure/plot_histogram_matching.py:27: FutureWarning:

`multichannel` is a deprecated argument name for `match_histograms`. It will be removed in version 1.0. Please use `channel_axis` instead.
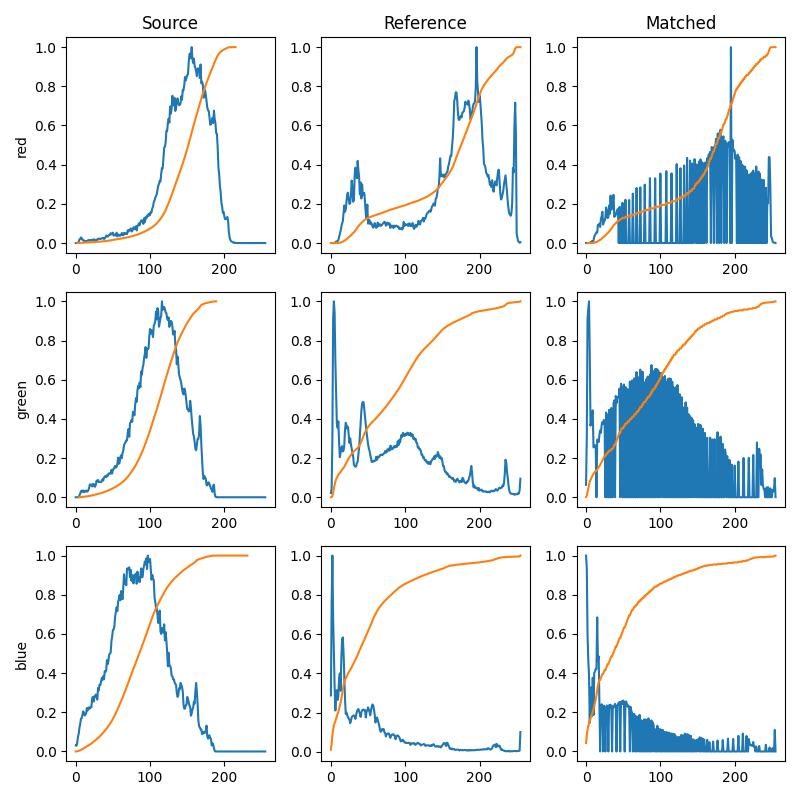
为了说明直方图匹配的效果,我们为每个RGB通道绘制直方图和累积直方图。显然,匹配的图像具有与每个通道的参考图像相同的累积直方图。
fig, axes = plt.subplots(nrows=3, ncols=3, figsize=(8, 8))


for i, img in enumerate((image, reference, matched)):
    for c, c_color in enumerate(('red', 'green', 'blue')):
        img_hist, bins = exposure.histogram(img[..., c], source_range='dtype')
        axes[c, i].plot(bins, img_hist / img_hist.max())
        img_cdf, bins = exposure.cumulative_distribution(img[..., c])
        axes[c, i].plot(bins, img_cdf)
        axes[c, 0].set_ylabel(c_color)

axes[0, 0].set_title('Source')
axes[0, 1].set_title('Reference')
axes[0, 2].set_title('Matched')

plt.tight_layout()
plt.show()
脚本的总运行时间: (0分0.599秒)