注解
此笔记本可在此处下载: 1D_interpolation.ipynb
一维插值
范围
有限数 \(N\) 共有个数据点可用: \(P_i = (x_i, y_i)\) , \(i \in \lbrace 0, \ldots, N \rbrace\)
插值是通过构建函数来填充间隙。 \(y(x)\)
https://en.wikipedia.org/wiki/Interpolation
# Setup
%matplotlib inline
import numpy as np
import matplotlib.pyplot as plt
import matplotlib
params = {'font.size'     : 14,
          'figure.figsize':(15.0, 8.0),
          'lines.linewidth': 2.,
          'lines.markersize': 15,}
matplotlib.rcParams.update(params)
让我们用Python来做
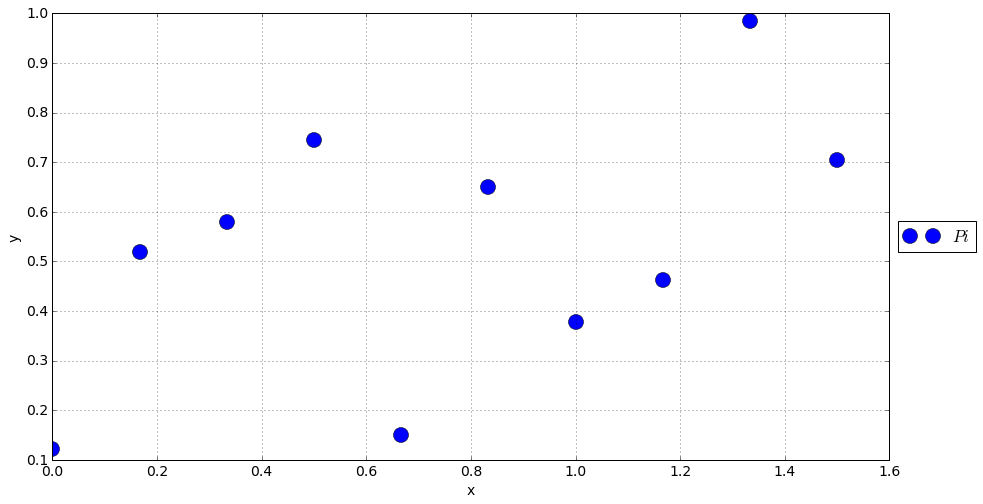
N = 10
xmin, xmax = 0., 1.5
xi = np.linspace(xmin, xmax, N)
yi = np.random.rand(N)

plt.plot(xi,yi, 'o', label = "$Pi$")
plt.grid()
plt.xlabel("x")
plt.ylabel("y")
plt.legend(loc='center left', bbox_to_anchor=(1, 0.5))
plt.show()
最近的( aka. 分段)插值
功能 \(y(x)\) 接受价值观 \(y_i\) 最近点的 \(P_i\) 上 \(x\) 方向。
from scipy import interpolate
x = np.linspace(xmin, xmax, 1000)
interp = interpolate.interp1d(xi, yi, kind = "nearest")
y_nearest = interp(x)

plt.plot(xi,yi, 'o', label = "$Pi$")
plt.plot(x, y_nearest, "-", label = "Nearest")
plt.grid()
plt.xlabel("x")
plt.ylabel("y")
plt.legend(loc='center left', bbox_to_anchor=(1, 0.5))
plt.show()
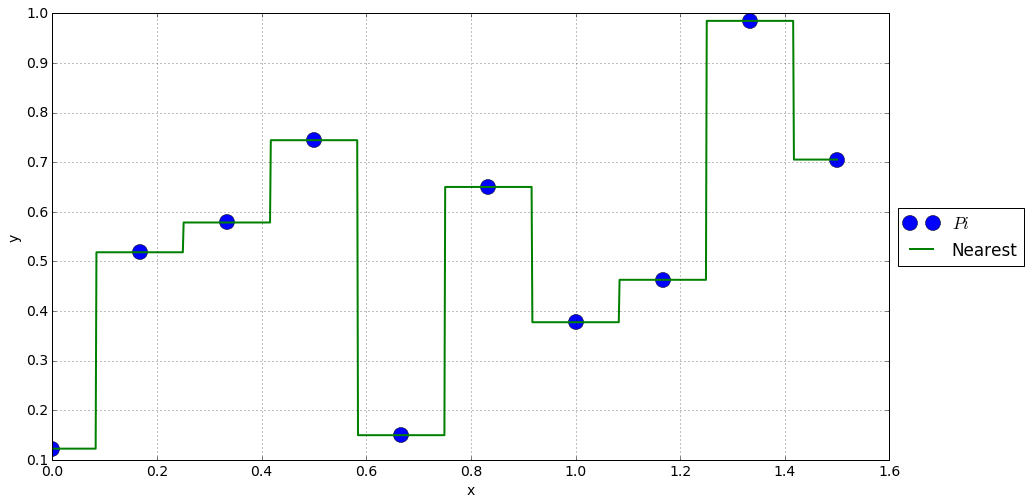
赞成的意见
\(y(x)\) 只接受现有值 \(y_i\) .
欺骗
不连续
线性插值
功能 \(y(x)\) 线性依赖于它的近邻。
from scipy import interpolate
x = np.linspace(xmin, xmax, 1000)
interp = interpolate.interp1d(xi, yi, kind = "linear")
y_linear = interp(x)

plt.plot(xi,yi, 'o', label = "$Pi$")
plt.plot(x, y_nearest, "-", label = "Nearest")
plt.plot(x, y_linear, "-", label = "Linear")
plt.grid()
plt.xlabel("x")
plt.ylabel("y")
plt.legend(loc='center left', bbox_to_anchor=(1, 0.5))
plt.show()
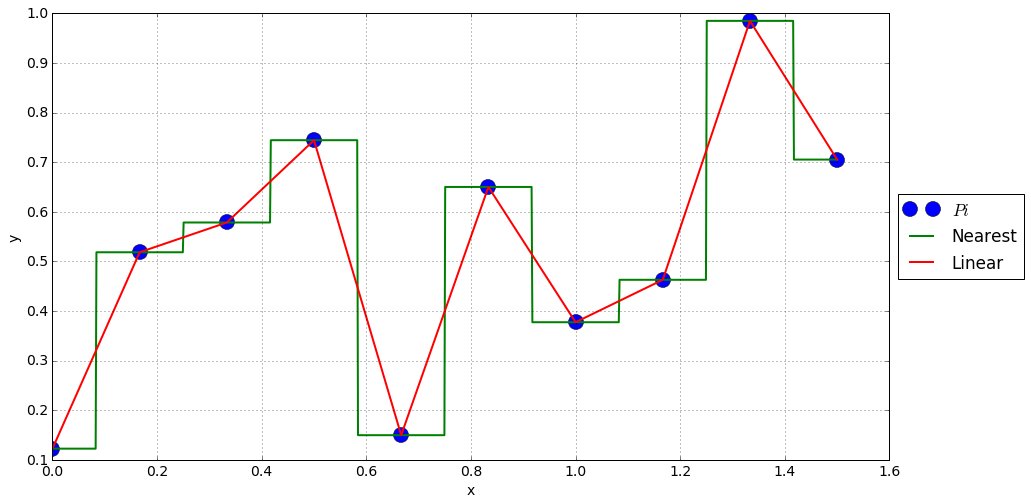
赞成的意见
\(y(x)\) stays in the limits of \(y_i\)
连续
欺骗
不连续的一阶导数。
样条插值
from scipy import interpolate
x = np.linspace(xmin, xmax, 1000)
interp2 = interpolate.interp1d(xi, yi, kind = "quadratic")
interp3 = interpolate.interp1d(xi, yi, kind = "cubic")
y_quad = interp2(x)
y_cubic = interp3(x)

plt.plot(xi,yi, 'o', label = "$Pi$")
plt.plot(x, y_nearest, "-", label = "Nearest")
plt.plot(x, y_linear,  "-", label = "Linear")
plt.plot(x, y_quad,    "-", label = "Quadratic")
plt.plot(x, y_cubic,   "-", label = "Cubic")
plt.grid()
plt.xlabel("x")
plt.ylabel("y")
plt.legend(loc='center left', bbox_to_anchor=(1, 0.5))
plt.show()
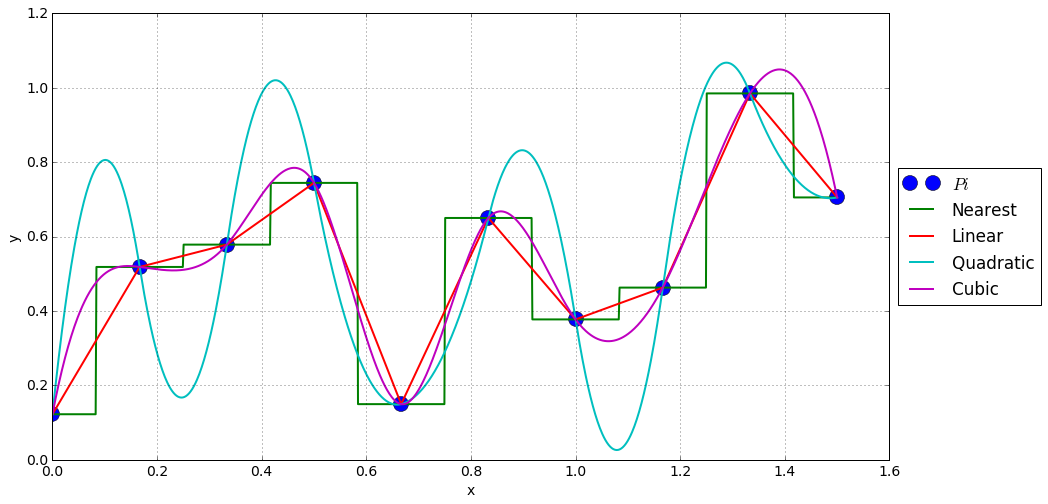
赞成的意见
更平滑
立方一般比平方更可靠
欺骗
点之间的可预测值较低。