pysal.viz.splot.esda.moran_scatterplot
-
pysal.viz.splot.esda.moran_scatterplot(moran, zstandard=True, p=None, ax=None, scatter_kwds=None, fitline_kwds=None)[源代码]¶ 莫兰散点图
参数: - moran : esda.moran实例
莫兰I值的全局、二元和局部自相关统计
- zstandard : 可选的布尔
如果为真,Moran散点图将显示Z标准化属性和空间滞后值。默认值为真。
- p : 可选浮动
如果给定,局部自相关分析的显著性P值阈值。点将按重要性着色。默认情况下,它不会着色。缺省=无。
- ax : Matplotlib轴实例,可选
如果给定,将在此轴内创建Moran图。缺省=无。
- scatter_kwds : 关键字参数,可选
用于创建和设计散点的关键字。缺省=无。
- fitline_kwds : 关键字参数,可选
用于创建和设计Moran Fitline的关键字。缺省=无。
返回: - fig : Matplotlib图实例
莫兰散射图
- ax : Matplotlib轴实例
绘制图形的轴
实例
进口
>>> import matplotlib.pyplot as plt
>>> from pysal.lib.weights.contiguity import Queen
>>> from pysal.lib import examples
>>> import geopandas as gpd
>>> from pysal.explore.esda.moran import (Moran, Moran_BV,
...                         Moran_Local, Moran_Local_BV)
>>> from pysal.viz.splot.esda import moran_scatterplot
加载数据并计算权重
>>> link_to_data = examples.get_path('Guerry.shp')
>>> gdf = gpd.read_file(link_to_data)
>>> x = gdf['Suicids'].values
>>> y = gdf['Donatns'].values
>>> w = Queen.from_dataframe(gdf)
>>> w.transform = 'r'
计算esda.moran对象
>>> moran = Moran(y, w)
>>> moran_bv = Moran_BV(y, x, w)
>>> moran_loc = Moran_Local(y, w)
>>> moran_loc_bv = Moran_Local_BV(y, x, w)
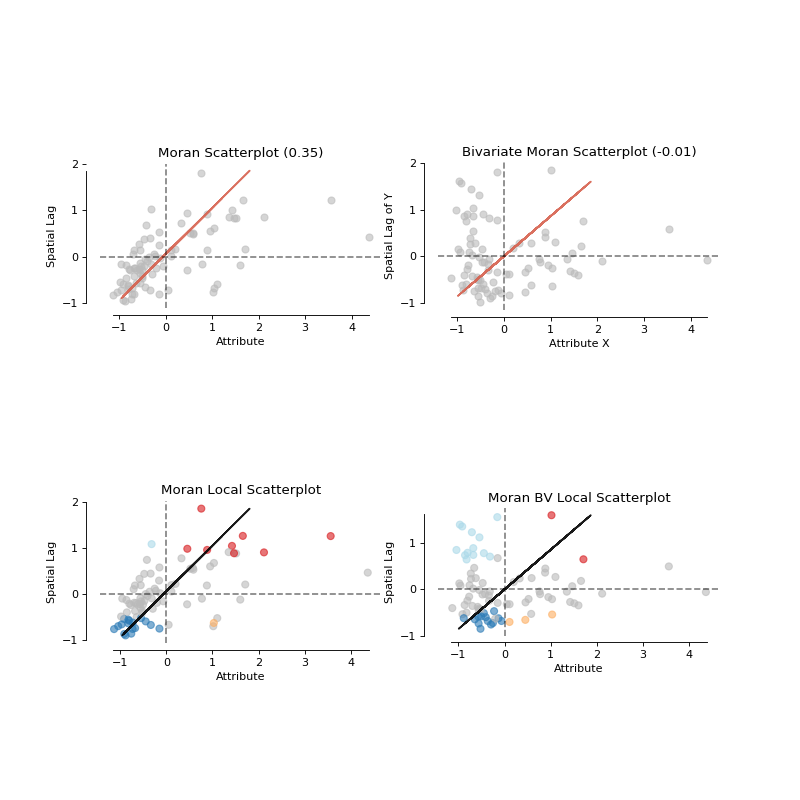
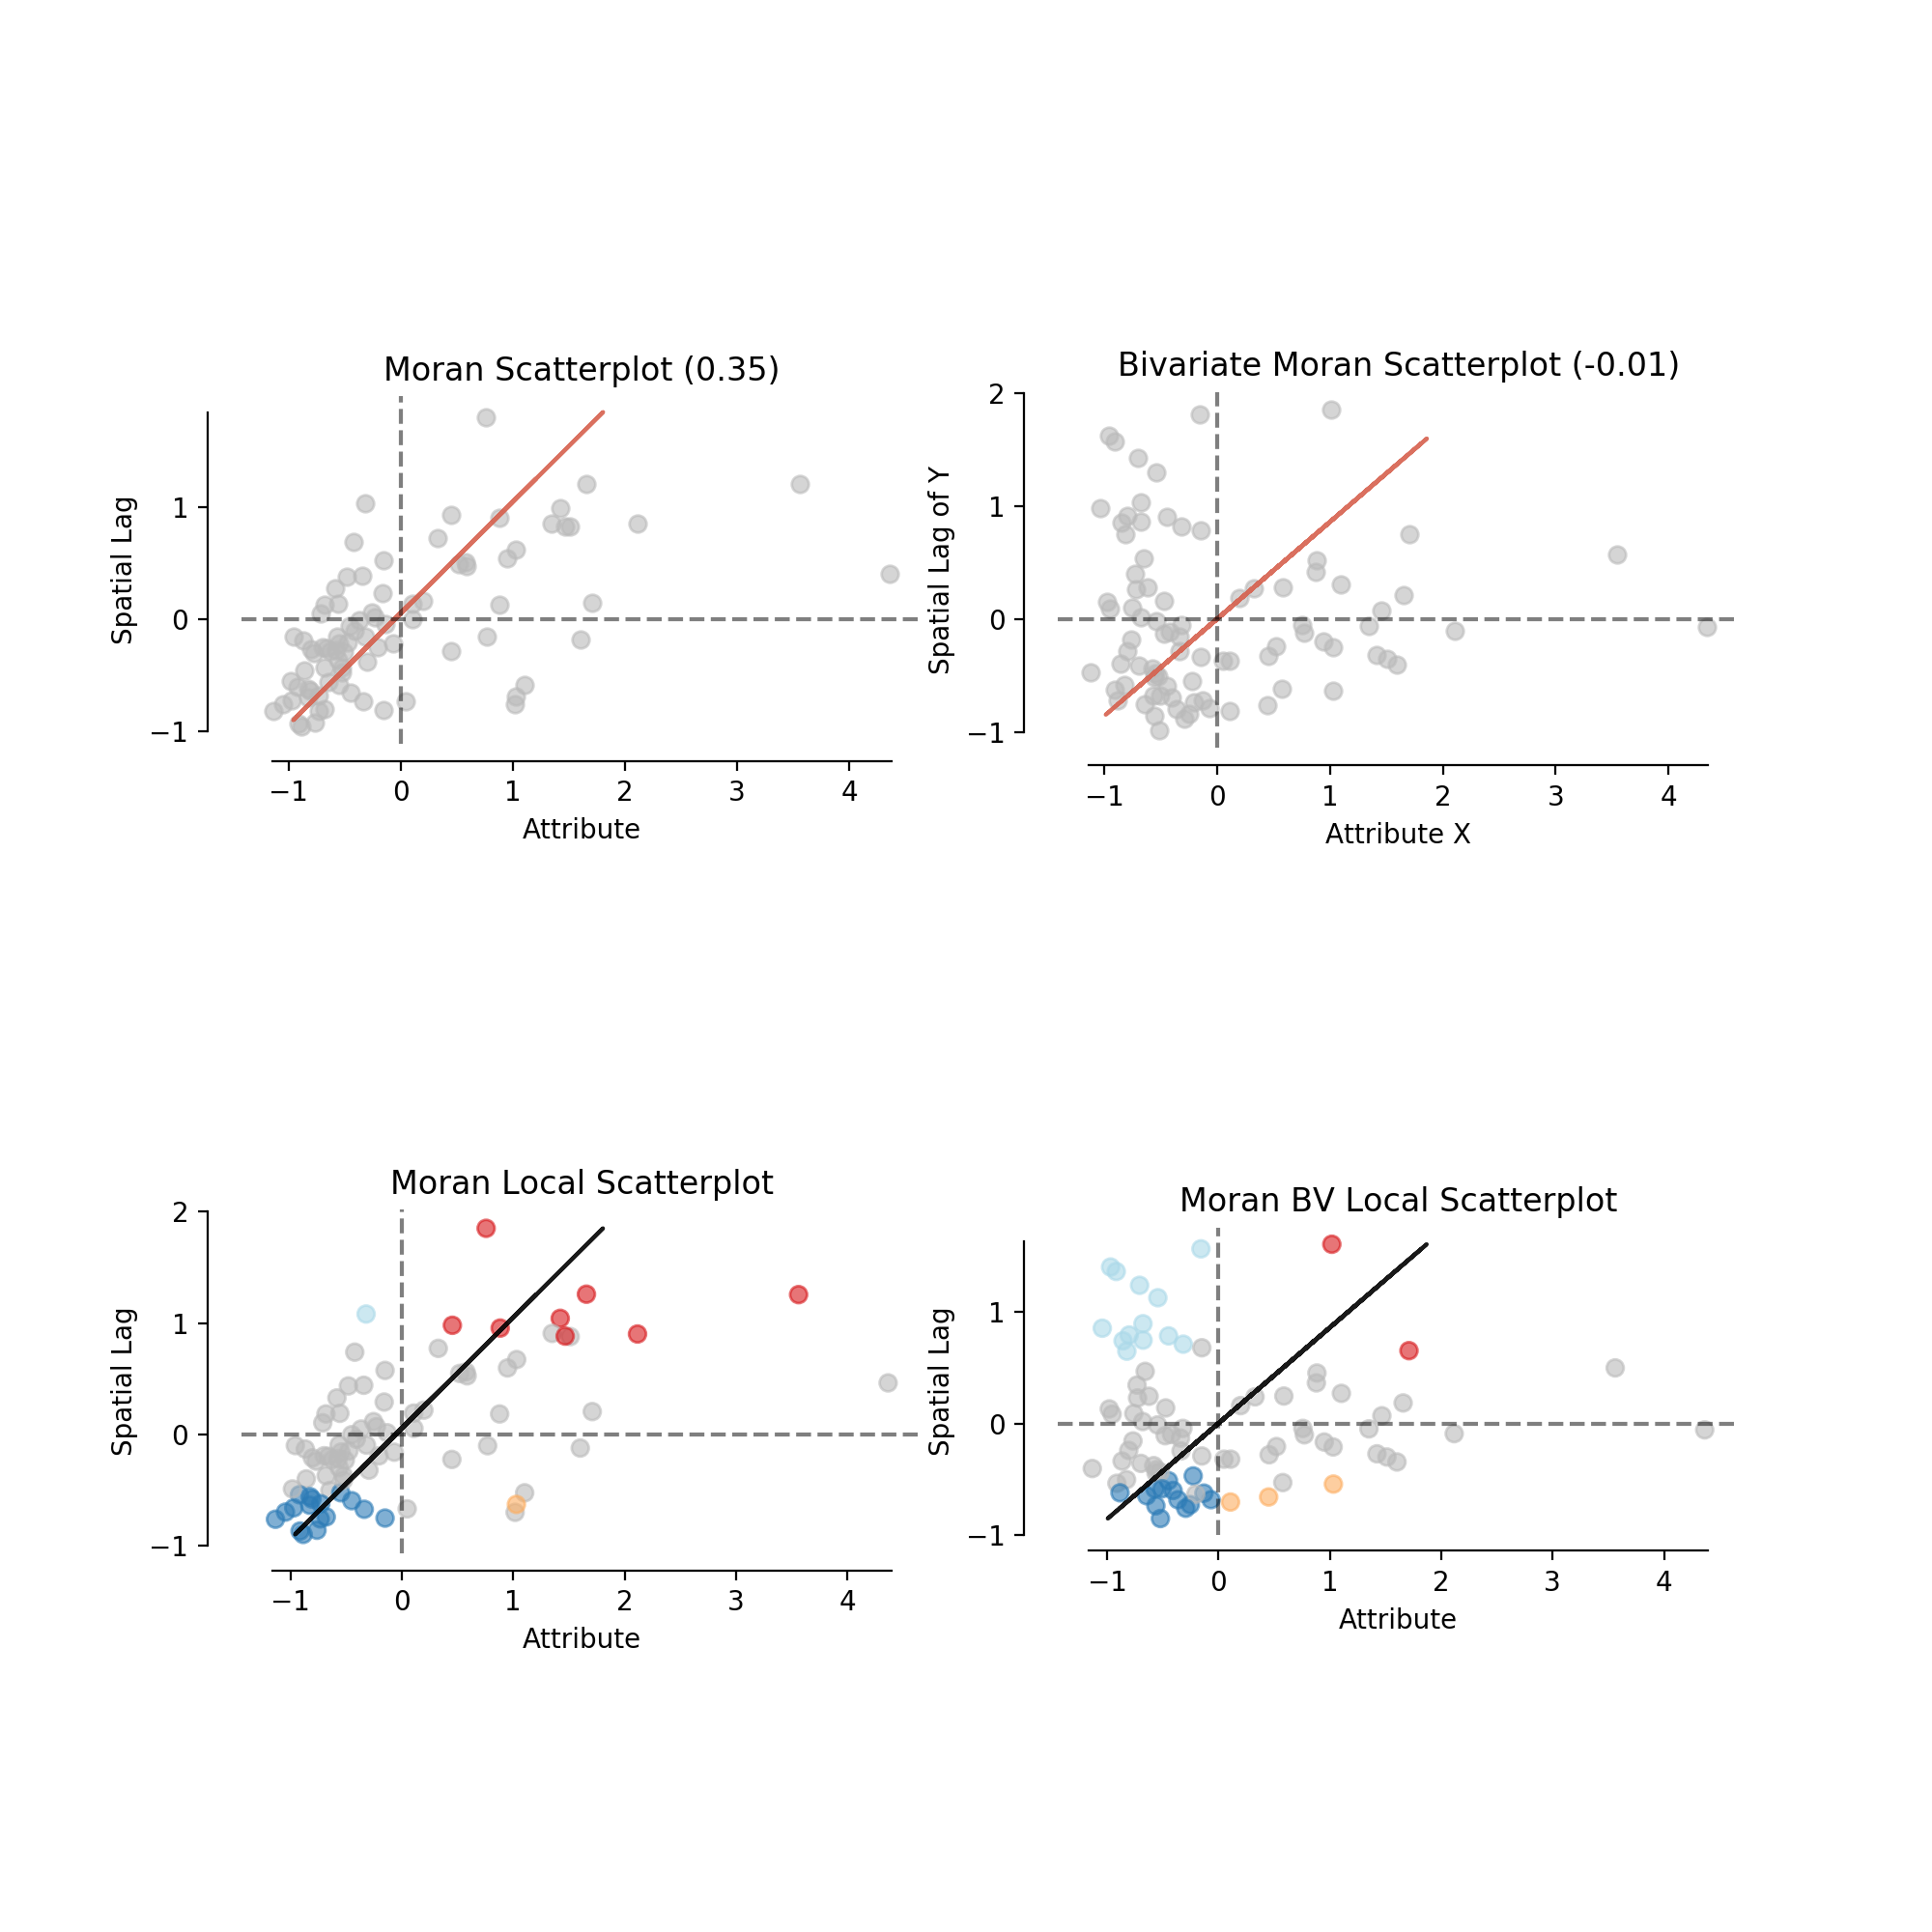
情节
>>> fig, axs = plt.subplots(2, 2, figsize=(10,10),
...                         subplot_kw={'aspect': 'equal'})
>>> moran_scatterplot(moran, p=0.05, ax=axs[0,0])
>>> moran_scatterplot(moran_loc, p=0.05, ax=axs[1,0])
>>> moran_scatterplot(moran_bv, p=0.05, ax=axs[0,1])
>>> moran_scatterplot(moran_loc_bv, p=0.05, ax=axs[1,1])
>>> plt.show()
(Source code, png, hires.png, pdf)
