备注
Go to the end 下载完整的示例代码
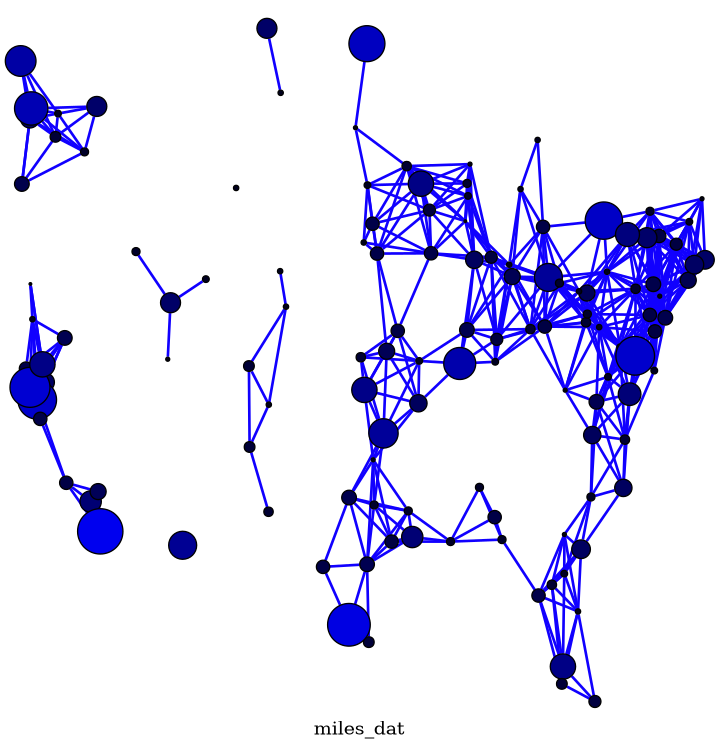
努斯·迈尔斯(Knuth Miles)
这是一个示例,说明如何将您自己的位置添加到节点,并让Graphviz“neato”定位边。
Miles_graph()从数据文件Miles_dat.txt返回128个美国城市的无向图。
这个例子在Knuth的书的1.1节中有描述 [1] [2] 。
此示例中使用的数据复制自 [2]. 文件名和标头已修改,以符合作者的要求,即不损坏原始源文件的内容和名称。
参考资料。
Loaded miles_dat.txt containing 128 cities.
Wrote miles.dot
Wrote miles.png
__author__ = """Aric Hagberg (aric.hagberg@gmail.com)"""


def miles_graph():
    """Return a graph from the data in miles_dat.txt.

    Edges are made between cities that are less then 300 miles apart.
    """
    import math
    import re
    import gzip

    G = pgv.AGraph(name="miles_dat")
    G.node_attr["shape"] = "circle"
    G.node_attr["fixedsize"] = "true"
    G.node_attr["fontsize"] = "8"
    G.node_attr["style"] = "filled"
    G.graph_attr["outputorder"] = "edgesfirst"
    G.graph_attr["label"] = "miles_dat"
    G.graph_attr["ratio"] = "1.0"
    G.edge_attr["color"] = "#1100FF"
    G.edge_attr["style"] = "setlinewidth(2)"

    cities = []
    for line in gzip.open("miles_dat.txt.gz", "rt"):
        if line.startswith("*"):  # skip comments
            continue
        numfind = re.compile(r"^\d+")

        if numfind.match(line):  # this line is distances
            dist = line.split()
            for d in dist:
                if float(d) < 300:  # connect if closer then 300 miles
                    G.add_edge(city, cities[i])
                i = i + 1
        else:  # this line is a city, position, population
            i = 1
            (city, coordpop) = line.split("[")
            cities.insert(0, city)
            (coord, pop) = coordpop.split("]")
            (y, x) = coord.split(",")
            G.add_node(city)
            n = G.get_node(city)
            # assign positions, scale to be something reasonable in points
            n.attr[
                "pos"
            ] = f"{-(float(x) - 7000) / 10.0:f},{(float(y) - 2000) / 10.0:f}"
            # assign node size, in sqrt of 1,000,000's of people
            d = math.sqrt(float(pop) / 1000000.0)
            n.attr["height"] = f"{d / 2}"
            n.attr["width"] = f"{d / 2}"
            # assign node color
            n.attr["fillcolor"] = f"#0000{int(d * 256):2x}"
            # empty labels
            n.attr["label"] = " "

    return G


if __name__ == "__main__":
    import warnings
    import pygraphviz as pgv

    # ignore Graphviz warning messages
    warnings.simplefilter("ignore", RuntimeWarning)

    G = miles_graph()
    print("Loaded miles_dat.txt containing 128 cities.")

    G.write("miles.dot")
    print("Wrote miles.dot")
    G.draw("miles.png", prog="neato", args="-n2")
    print("Wrote miles.png")
Total running time of the script: (0分0.104秒)