更改绘图区和图例的布局
画布中图表的布局可以通过使用布局类实例的layout属性来设置。
海图布图
尺寸和位置
图表可以放置在其容器中。 x 和 y 调整位置, w 和 h 调整大小。单位是容器的比例。图表不能定位在其容器外部,宽度和高度是主要约束:如果x+w>1,则x=1-w。
x是从左侧开始的水平位置
y是从顶部开始的垂直位置
h是图表相对于其容器的高度
w是盒子的宽度
模式
除了大小和位置之外,相关属性的模式也可以设置为 factor 或 edge . 系数是默认值:
layout.xMode = edge
靶标
布局目标可以设置为 outer 或 inner . 默认值为 outer :
layout.layoutTarget = inner
图例布局
图例的位置可以通过设置其位置来控制: r , l , t , b 和 tr ,分别表示右、左、上、下和右上。默认值为 r .
legend.position = 'tr'
或应用手动布局:
legend.layout = ManualLayout()
from openpyxl import Workbook, load_workbook
from openpyxl.chart import ScatterChart, Series, Reference
from openpyxl.chart.layout import Layout, ManualLayout
wb = Workbook()
ws = wb.active
rows = [
['Size', 'Batch 1', 'Batch 2'],
[2, 40, 30],
[3, 40, 25],
[4, 50, 30],
[5, 30, 25],
[6, 25, 35],
[7, 20, 40],
]
for row in rows:
ws.append(row)
ch1 = ScatterChart()
xvalues = Reference(ws, min_col=1, min_row=2, max_row=7)
for i in range(2, 4):
values = Reference(ws, min_col=i, min_row=1, max_row=7)
series = Series(values, xvalues, title_from_data=True)
ch1.series.append(series)
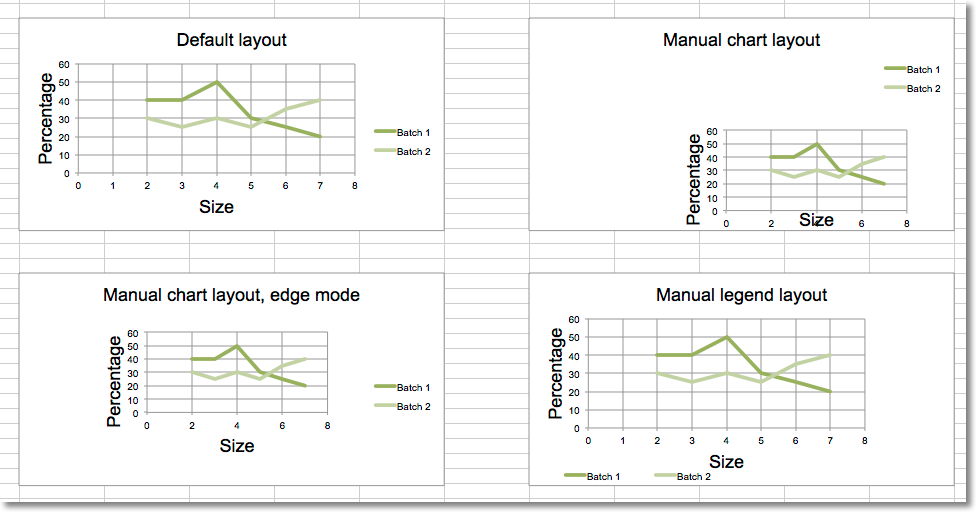
ch1.title = "Default layout"
ch1.style = 13
ch1.x_axis.title = 'Size'
ch1.y_axis.title = 'Percentage'
ch1.legend.position = 'r'
ws.add_chart(ch1, "B10")
from copy import deepcopy
# Half-size chart, bottom right
ch2 = deepcopy(ch1)
ch2.title = "Manual chart layout"
ch2.legend.position = "tr"
ch2.layout=Layout(
manualLayout=ManualLayout(
x=0.25, y=0.25,
h=0.5, w=0.5,
)
)
ws.add_chart(ch2, "H10")
# Half-size chart, centred
ch3 = deepcopy(ch1)
ch3.layout = Layout(
ManualLayout(
x=0.25, y=0.25,
h=0.5, w=0.5,
xMode="edge",
yMode="edge",
)
)
ch3.title = "Manual chart layout, edge mode"
ws.add_chart(ch3, "B27")
# Manually position the legend bottom left
ch4 = deepcopy(ch1)
ch4.title = "Manual legend layout"
ch4.legend.layout = Layout(
manualLayout=ManualLayout(
yMode='edge',
xMode='edge',
x=0, y=0.9,
h=0.1, w=0.5
)
)
ws.add_chart(ch4, "H27")
wb.save("chart_layout.xlsx")
这将生成四个图表,说明各种可能性: