面积图
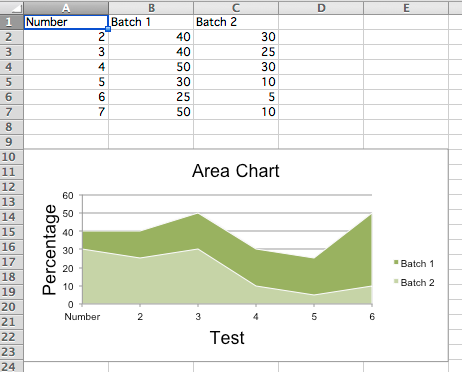
二维面积图
面积图与折线图类似,另外,绘制线下方的区域被填充。通过将分组设置为“标准”、“堆积”或“百分比堆积”,可以使用不同的变体;默认值为“标准”。
from openpyxl import Workbook
from openpyxl.chart import (
    AreaChart,
    Reference,
    Series,
)

wb = Workbook()
ws = wb.active

rows = [
    ['Number', 'Batch 1', 'Batch 2'],
    [2, 40, 30],
    [3, 40, 25],
    [4, 50, 30],
    [5, 30, 10],
    [6, 25, 5],
    [7, 50, 10],
]

for row in rows:
    ws.append(row)

chart = AreaChart()
chart.title = "Area Chart"
chart.style = 13
chart.x_axis.title = 'Test'
chart.y_axis.title = 'Percentage'

cats = Reference(ws, min_col=1, min_row=1, max_row=7)
data = Reference(ws, min_col=2, min_row=1, max_col=3, max_row=7)
chart.add_data(data, titles_from_data=True)
chart.set_categories(cats)

ws.add_chart(chart, "A10")

wb.save("area.xlsx")
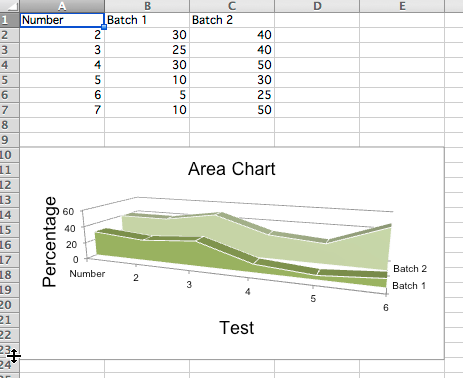
三维面积图
也可以创建三维面积图
from openpyxl import Workbook
from openpyxl.chart import (
    AreaChart3D,
    Reference,
    Series,
)

wb = Workbook()
ws = wb.active

rows = [
    ['Number', 'Batch 1', 'Batch 2'],
    [2, 30, 40],
    [3, 25, 40],
    [4 ,30, 50],
    [5 ,10, 30],
    [6,  5, 25],
    [7 ,10, 50],
]

for row in rows:
    ws.append(row)

chart = AreaChart3D()
chart.title = "Area Chart"
chart.style = 13
chart.x_axis.title = 'Test'
chart.y_axis.title = 'Percentage'
chart.legend = None

cats = Reference(ws, min_col=1, min_row=1, max_row=7)
data = Reference(ws, min_col=2, min_row=1, max_col=3, max_row=7)
chart.add_data(data, titles_from_data=True)
chart.set_categories(cats)

ws.add_chart(chart, "A10")

wb.save("area3D.xlsx")
这将生成一个简单的三维面积图,其中第三个轴可用于替换图例: