注解
点击 here 下载完整的示例代码
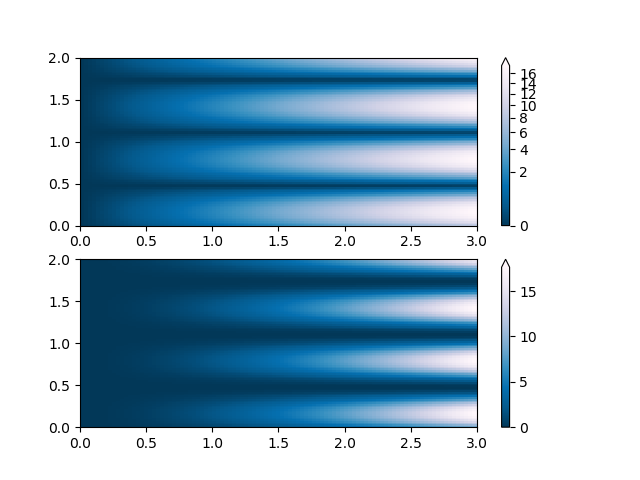
颜色映射规格化电源
演示如何使用norm以非线性方式将颜色映射到数据上。
import numpy as np
import matplotlib.pyplot as plt
import matplotlib.colors as colors

N = 100
X, Y = np.mgrid[-3:3:complex(0, N), -2:2:complex(0, N)]

'''
PowerNorm: Here a power-law trend in X partially obscures a rectified
sine wave in Y. We can remove the power law using a PowerNorm.
'''
X, Y = np.mgrid[0:3:complex(0, N), 0:2:complex(0, N)]
Z1 = (1 + np.sin(Y * 10.)) * X**(2.)

fig, ax = plt.subplots(2, 1)

pcm = ax[0].pcolormesh(X, Y, Z1, norm=colors.PowerNorm(gamma=1./2.),
                       cmap='PuBu_r')
fig.colorbar(pcm, ax=ax[0], extend='max')

pcm = ax[1].pcolormesh(X, Y, Z1, cmap='PuBu_r')
fig.colorbar(pcm, ax=ax[1], extend='max')

plt.show()
关键词:matplotlib代码示例,codex,python plot,pyplot Gallery generated by Sphinx-Gallery