KML造型
介绍
当geoserver创建和输出时,keyhole markup langauge(kml)使用 Styled Layer Descriptors (单反)。这是用于标准WMS输出格式样式的相同方法,但与GoogleEarth通常的样式有点不同,其行为更像级联样式表(CSS)。在sld文件中,映射的样式被指定为一系列规则,然后在kml输出中对匹配这些规则的数据进行适当的样式设置。对于不熟悉SLD的人来说,一个好的起点是 SLD简介 .本指南的其余部分包含有关如何构建SLD文档以影响geoserver生成的kml外观的信息。
目录
从CSS生成SLD
CSS扩展提供了使用轻量级“级联样式表”语法生成SLD文件的功能。除了当前层的属性引用之外,当您编辑样式时,CSS GUI还提供了一个实时地图预览。
生成的样式将与来自geoserver的kml输出无缝工作。
手工创建SLD
可以直接编辑SLD文件,而不是使用CSS扩展名。有关编辑SLD的最完整探索,请参见 造型 第节。下面的例子展示了一些基本样式是如何在GoogleEarth中出现的。
SLD结构
以下是SLD文档的框架。它可以作为扩展的基础,从而创建更有趣和复杂的样式。
<StyledLayerDescriptor version="1.0.0"
   xsi:schemaLocation="http://www.opengis.net/sld StyledLayerDescriptor.xsd"
   xmlns="http://www.opengis.net/sld"
   xmlns:ogc="http://www.opengis.net/ogc"
   xmlns:xlink="http://www.w3.org/1999/xlink"
   xmlns:xsi="http://www.w3.org/2001/XMLSchema-instance">
   <NamedLayer>
      <Name>Default Line</Name>
      <UserStyle>
         <Title>My Style</Title>
         <Abstract>A style</Abstract>
         <FeatureTypeStyle>
            <Rule>

                  <!-- symbolizers go here -->

            </Rule>
         </FeatureTypeStyle>
      </UserStyle>
   </NamedLayer>
</StyledLayerDescriptor>
图3:SLD基本结构
为了测试这个文档中的代码片段,创建一个包含如图3所示内容的SLD,然后在其中添加您希望测试的特定代码 <!-- symbolizers go here --> .要查看、编辑或向geoserver添加SLD文件,请导航到 配置 > Data > 风格 .
点
在SLD中,点的样式是通过点符号指定的。空的pointsymboner元素将导致默认的kml样式:
<PointSymbolizer>
</PointSymbolizer>
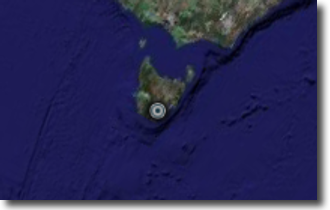
图4:默认点
可以指定的三个方面是 颜色 , 不透明性 和 icon .
点颜色
点的颜色用 CssParameter 元素和a fill 属性。颜色被指定为六位十六进制代码。
<PointSymbolizer>
   <Graphic>
      <Mark>
         <Fill>
            <CssParameter name="fill">#ff0000</CssParameter>
         </Fill>
      </Mark>
   </Graphic>
</PointSymbolizer>
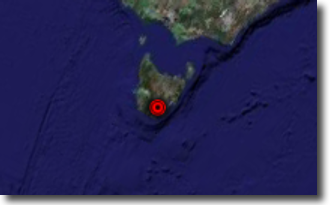
Figure 5: Setting the point color (#ff0000 = 100% red)
点不透明度
点的不透明度由cssparameter元素和 fill-opacity 属性。不透明度指定为介于 0 和 1 ,0完全透明,1完全不透明。
<PointSymbolizer>
   <Graphic>
      <Mark>
         <Fill>
            <CssParameter name="fill-opacity">0.5</CssParameter>
         </Fill>
      </Mark>
   </Graphic>
</PointSymbolizer>
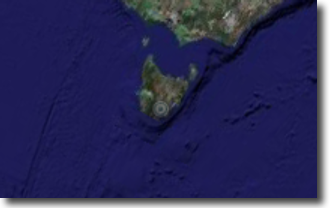
Figure 6: Setting the point opacity (0.5 = 50% opaque)
点图标
可以使用 ExternalGraphic 元素:
<PointSymbolizer>
   <Graphic>
      <ExternalGraphic>
         <OnlineResource xlink:type="simple"
            xlink:href="http://maps.google.com/mapfiles/kml/pal3/icon55.png"/>
         <Format>image/png</Format>
      </ExternalGraphic>
   </Graphic>
</PointSymbolizer>
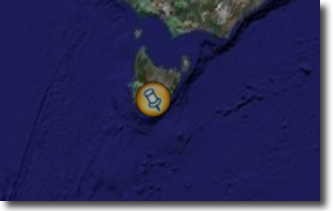
图7:点的自定义图标
在图7中,自定义图标被指定为远程URL。也可以将图形放在地理服务器中 styles 目录,然后仅指定文件名:
<PointSymbolizer>
   <Graphic>
      <ExternalGraphic>
         <OnlineResource xlink:type="simple" xlink:href="icon55.png"/>
         <Format>image/png</Format>
      </ExternalGraphic>
   </Graphic>
</PointSymbolizer>
图8:为图形点指定本地文件
线
线条样式通过 LineSymbolizer .一个空的 LineSymbolizer 元素将生成默认的kml样式:
<LineSymbolizer>
</LineSymbolizer>
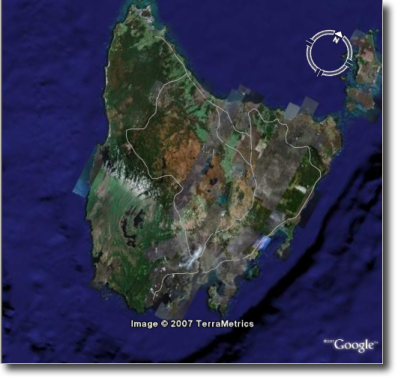
图9:默认行
结果行的各个方面,可以通过 LineSymbolizer 是 颜色 , 宽度 和 不透明性 .
线条颜色
线条的颜色用 CssParameter 元素和a stroke 属性。颜色被指定为六位十六进制代码。
<LineSymbolizer>
   <Stroke>
      <CssParameter name="stroke">#ff0000</CssParameter>
   </Stroke>
</LineSymbolizer>
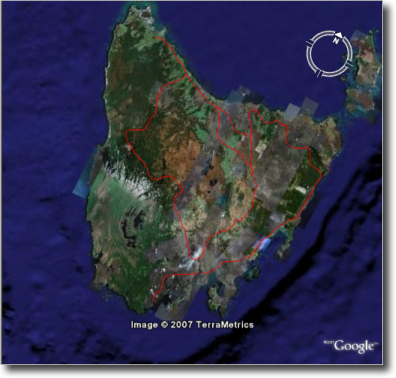
Figure 10: Line rendered with color #ff0000 (100% red)
线条宽度
行的宽度用 CssParameter 元素和a stroke-width 属性。宽度指定为整数(像素):
<LineSymbolizer>
   <Stroke>
      <CssParameter name="stroke-width">5</CssParameter>
   </Stroke>
</LineSymbolizer>
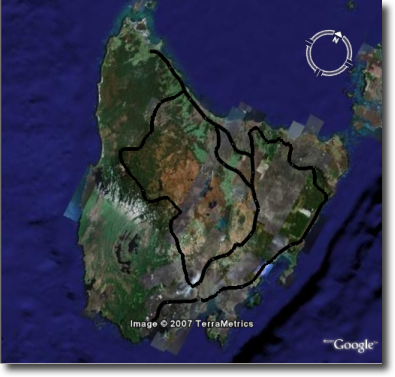
图11:宽度为五(5)像素的线条
线条不透明度
线条的不透明度用 CssParameter 元素和a fill-opacity 属性。不透明度指定为介于 0 和 1 ,0完全透明,1完全不透明。
<LineSymbolizer>
   <Stroke>
      <CssParameter name="stroke-opacity">0.5</CssParameter>
   </Stroke>
</LineSymbolizer>
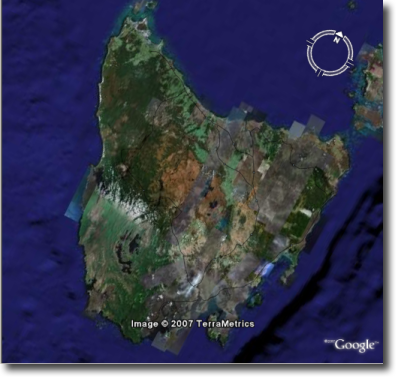
图12:不透明度为50%的线条
多边形
多边形的样式通过 PolygonSymbolizer .一个空的 PolygonSymbolizer 元素将生成默认的kml样式:
<PolygonSymbolizer>
</PolygonSymbolizer>
多边形比点和线有更多的样式选择,因为多边形既有内部(“填充”)又有轮廓(“笔划”)。多边形的各个方面可以通过 PolygonSymbolizer 是 笔划颜色 , 笔画宽度 , 笔划不透明度 , 填充颜色 和 填充不透明度 .
多边形笔划颜色
多边形的轮廓颜色用 CssParameter 元素和 stroke 属性内部 Stroke 元素。颜色指定为6位十六进制代码:
<PolygonSymbolizer>
   <Stroke>
      <CssParameter name="stroke">#0000FF</CssParameter>
   </Stroke>
</PolygonSymbolizer>
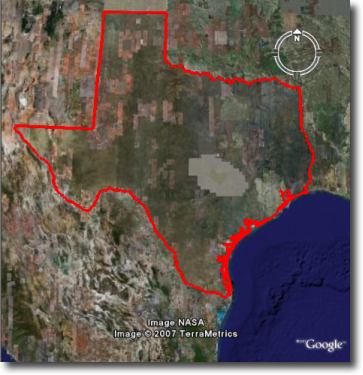
Figure 13: Outline of a polygon (#0000FF or 100% blue)
多边形笔划宽度
多边形的轮廓宽度用 CssParameter 元素和 stroke-width 属性内部 Stroke 元素。宽度指定为整数。
<PolygonSymbolizer>
   <Stroke>
      <CssParameter name="stroke-width">5</CssParameter>
   </Stroke>
</PolygonSymbolizer>
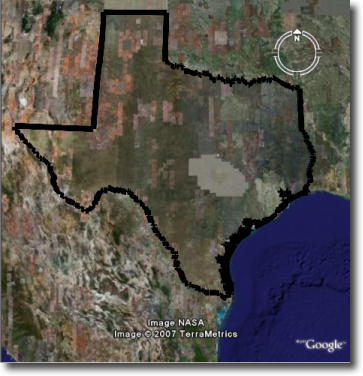
图14:笔划宽度为五(5)个像素的多边形
多边形笔划不透明度
多边形的笔划不透明度指定为 CssParameter 元素和 stroke 属性内部 Stroke 元素。不透明度指定为介于 0 和 1 ,0完全透明,1完全不透明。
<PolygonSymbolizer>
   <Stroke>
      <CssParameter name="stroke-opacity">0.5</CssParameter>
   </Stroke>
</PolygonSymbolizer>
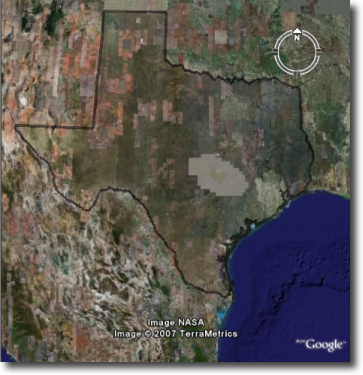
图15:多边形笔划不透明度为0.5(50%不透明)
多边形填充颜色
多边形的填充颜色用 CssParameter 元素和 fill 属性内部 Fill 元素。颜色指定为六位十六进制代码:
<PolygonSymbolizer>
   <Fill>
      <CssParameter name="fill">#0000FF</CssParameter>
   </Fill>
</PolygonSymbolizer>
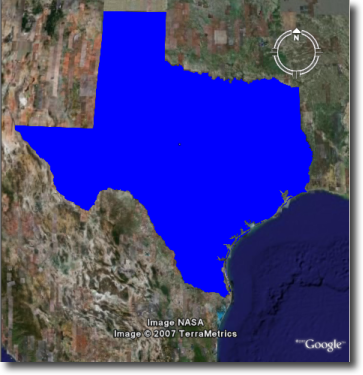
Figure 16: Polygon fill color of #0000FF (100% blue)
多边形填充不透明度
多边形的填充不透明度指定为 CssParameter 元素和 fill-opacity 属性内部 Fill 元素。不透明度指定为介于 0 和 1 ,0完全透明,1完全不透明。
<PolygonSymbolizer>
   <Fill>
      <CssParameter name="fill-opacity">0.5</CssParameter>
   </Fill>
</PolygonSymbolizer>
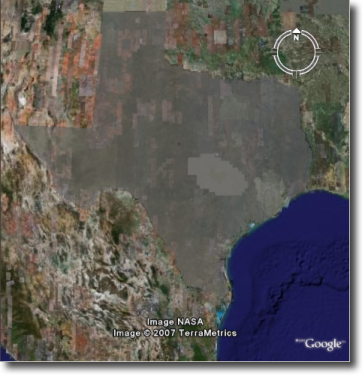
图17:多边形填充不透明度为0.5(50%不透明)
文本标签
有两种方法可以为GoogleEarth中的某个功能指定标签。第一个是使用freemaker模板(link?)第二个是 TextSymbolizer .模板优先于符号。
自由标记模板
通过FreeMarker模板指定标签涉及创建一个名为 title.ftl 把它放进 workspaces/<ws name>/<datastore name>/<feature type name> 要标记的数据集的目录(在geoserver数据目录内)。例如,要创建模板以标记 states 按状态名称排序的数据集将在此处创建文件: <data_dir>/workspaces/topp/states_shapefile/states/title.ftl .文件内容如下:
${STATE_NAME.value}

Figure 18: Using a Freemarker template to display the value of STATE_NAME
有关Placemark模板的更多信息,请参阅我们的完整教程(即将提供链接)。
TextSymbolizer
在SLD中,标签是用 TextSymbolizer .(注意 ogc: 上的前缀 PropertyName 元素。)
<TextSymbolizer>
   <Label>
      <ogc:PropertyName>STATE_NAME</ogc:PropertyName>
   </Label>
</TextSymbolizer>
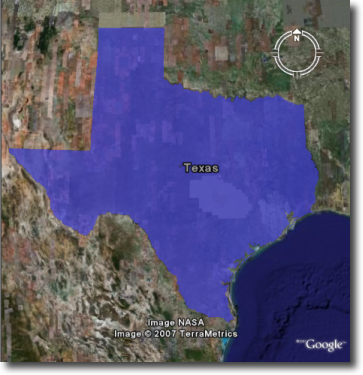
Figure 19: Using a TextSymbolizer to display the value of STATE_NAME
结果标签的各个方面,可以通过 TextSymbolizer 是 颜色 和 不透明性 .
文本符号颜色
标签的颜色用 CssParameter 元素和 fill 属性内部 Fill 元素。颜色指定为六位十六进制代码:
<TextSymbolizer>
   <Label>
      <ogc:PropertyName>STATE_NAME</ogc:PropertyName>
   </Label>
   <Fill>
      <CssParameter name="fill">#000000</CssParameter>
   </Fill>
</TextSymbolizer>
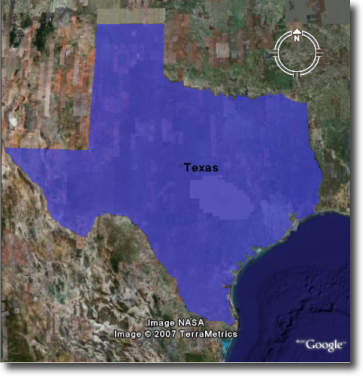
Figure 20: TextSymbolizer with black text color (#000000)
文本符号不透明度
标签的不透明度指定为 CssParameter 元素和 fill-opacity 属性内部 Fill 元素。不透明度指定为介于 0 和 1 ,0完全透明,1完全不透明。
<TextSymbolizer>
   <Label>
      <ogc:PropertyName>STATE_NAME</ogc:PropertyName>
   </Label>
   <Fill>
      <CssParameter name="fill-opacity">0.5</CssParameter>
   </Fill>
</TextSymbolizer>
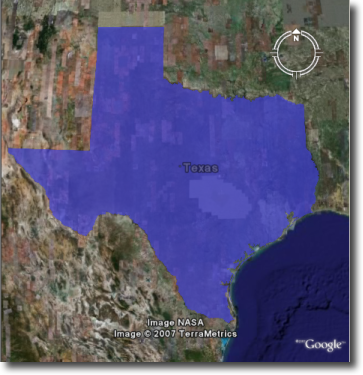
图21:不透明度为0.5(50%不透明)的文本符号
描述
使用kml时,每个功能都链接到一个描述,单击该功能时可以访问该描述。默认情况下,geoserver为特定功能创建所有属性和值的列表。
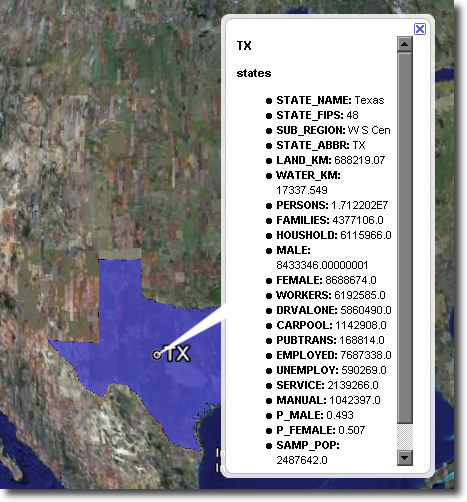
图22:特性的默认描述
可以修改此默认行为。很像FeatureType标题,通过创建 title.ftl 模板,可通过创建名为 description.ftl 并将其放入数据集的要素类型目录(在geoserver数据目录中)。例如,要创建模板以提供状态数据集的描述,可以创建文件: <data_dir>/workspaces/topp/states_shapefile/states/description.ftl .例如,如果描述模板的内容是:
This is the state of ${STATE_NAME.value}.
结果描述如下:
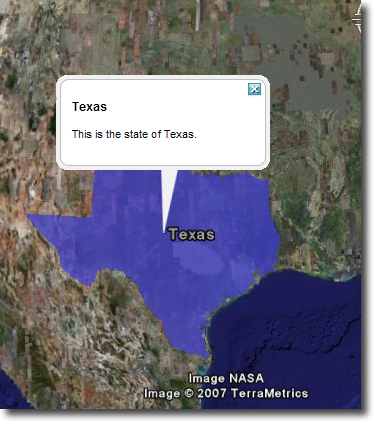
图23:自定义描述
也可以为给定名称空间中的所有FeatureType创建一个描述模板。为此,请创建 description.ftl 如上所述归档,并另存为 <data_dir>/templates/<workspace>/description.ftl .请注意,如果为还具有关联命名空间描述模板的特定FeatureType创建描述模板,则FeatureType模板(即最特定的模板)将优先。
还可以使用HTML和数据属性的组合来创建更复杂的描述。关于如何使用模板来创建描述的完整教程可以在我们的页面上的kml placemark模板上找到。(链接?)