矢量瓦片教程
本教程将演示如何使用地理服务器矢量分片输出。
为什么使用矢量图块?
矢量平铺的优势在于:
渲染由客户端完成 (例如,OpenLayers),而不是服务器。这允许不同的地图/应用程序以不同的方式设置地图样式,而无需重新配置GeoServer。
矢量瓦片的大小通常较小 比图像瓦片更快的数据传输速度和更低的带宽使用。
GeoWebCache与GeoServer一起嵌入,有效地存储矢量瓦片数据。因为样式是由客户端而不是服务器完成的, GeoWebCache只需要为所有不同的样式存储一个磁贴 .
因为矢量数据在客户机上可用, high-resolution maps can be drawn without corresponding increases in bandwidth .
客户端具有对实际功能信息的本机访问权限 (属性和几何),允许非常复杂的渲染。
另一方面,矢量瓦片的主要缺点是,可能需要对地理数据进行预处理,以允许客户端绘制所需的图形(类似于图像地图的预处理数据)。考虑到这一点, 矢量瓦片应仅用于渲染 .
矢量图块格式
geoserver还可以生成三种格式的矢量图块:geojson、topojson和mapbox vector(mvt)。Openlayers和其他客户机也支持这些功能。
MVT是生产的首选格式。
格式 |
MIME |
描述 |
|---|---|---|
|
推荐格式 这是一种高效的二进制格式,几乎所有矢量瓦片应用程序都广泛支持这种格式。 |
|
|
这是一种人类可读的JSON格式。尽管许多地理空间应用程序支持geojson数据集,但很少有矢量图块应用程序支持这种格式的图块。由开放层3支持。 |
|
|
这是一种非常复杂但具有一定人类可读性的JSON格式,非常适合于多边形覆盖。它不是一个得到广泛支持的应用程序,很少有向量切片应用程序支持它。由Open Layer 3支持。 |
在geoWebcache中发布矢量图块
我们将通过geowebcache发布我们的向量图块,并在定制的openlayers应用程序中发布该层。
在本教程中,我们将使用 opengeo:countries 为了展示这些功能,尽管稍加修改,任何层都可以。
备注
下载 Admin 0 - Countries 将图层形状化并发布为 opengeo:countries .
在GeoServer管理界面中,单击
Tile Layers在下面Tile Caching.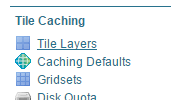
瓦片层
点击
opengeo:countries在图层列表中。默认情况下,瓦片格式为
image/jpeg和image/png. 选中以下矢量瓦片格式的复选框:application/json;type=geojsonapplication/json;type=topojsonapplication/vnd.mapbox-vector-tile
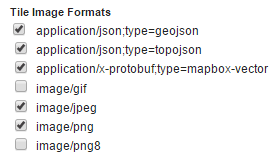
矢量瓦片格式
点击
Save.
我们的蛋卷现在可以上桌了。
创建OpenLayers应用程序-TMS矢量切片
创建
www/tms-vectortilesGeoserver数据目录中的目录。下载 latest version of OpenLayers 。下载v<ol-Version>-Package.zip file`_.
将以下文件从下载的归档文件解压缩到步骤1中创建的目录:
v<ol-version>-package/dist/ol.jsv<ol-version>-package/ol.css
在文本编辑器中,创建包含以下内容的新文件:
<!DOCTYPE html -->
<html>
<head>
  <title>Vector tiles</title>
  <script src="ol.js"></script>
  <link rel="stylesheet" href="ol.css">
  <style>
    html, body {
      font-family: sans-serif;
      width: 100%;
    }
    .map {
      height: 500px;
      width: 100%;
    }
  </style>
</head>
<body>
  <h3>Mapbox Protobuf - vector tiles TMS</h3>
  <div id="map" class="map"></div>
  <script>

  var style_simple = new ol.style.Style({
    fill: new ol.style.Fill({
      color: '#ADD8E6'
    }),
    stroke: new ol.style.Stroke({
      color: '#880000',
      width: 1
    })
  });

  function simpleStyle(feature) {
    return style_simple;
  }

  var layer = 'opengeo:countries';
  var projection_epsg_no = '900913';
  var map = new ol.Map({
    target: 'map',
    view: new ol.View({
      center: [0, 0],
      zoom: 2
    }),
    layers: [new ol.layer.VectorTile({
      style:simpleStyle,
      source: new ol.source.VectorTile({
        tilePixelRatio: 1, // oversampling when > 1
        tileGrid: ol.tilegrid.createXYZ({maxZoom: 19}),
        format: new ol.format.MVT(),
        url: '/geoserver/gwc/service/tms/1.0.0/' + layer +
            '@EPSG%3A'+projection_epsg_no+'@pbf/{z}/{x}/{-y}.pbf'
      })
    })]
  });
  </script>
</body>
</html>
将此文件保存在上面创建的目录中
index.html.导航到
http://localhost:8080/geoserver/www/tms-vectortiles/index.html并验证输出是否显示没有任何错误。备注
如果您的地理服务器部署在
http://localhost:8080/geoserver/,则请调整上述URL。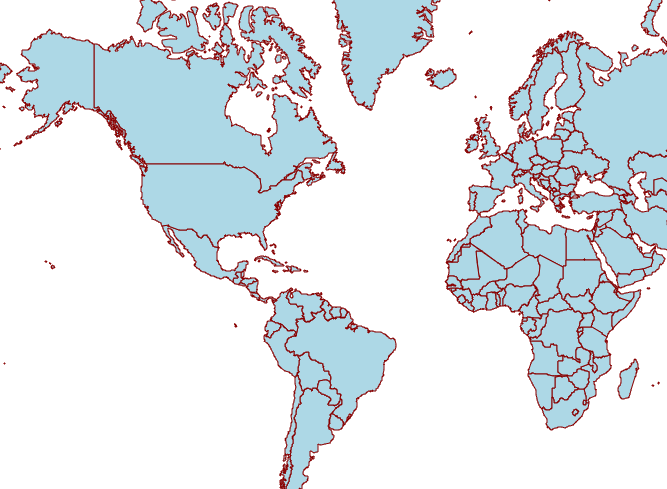
矢量瓦片输出
这些图块由Openlayers客户端呈现。
创建OpenLayers应用程序-WMS矢量切片
备注
WMS请求的矢量切片允许通过设置 tiled=false 参数设置为 getMap 请求。当为快速变化的源数据提供服务时,此设置可能特别有用,这些源数据应该经常保持最新以供显示。但是,在渲染性能方面,如果每个分块的要素很少,并且源向量数据中的属性数量有限,则向量分块可以比PNG更快。反之亦然,对于包含大量具有较长属性列表的要素的分块,PNG可能仍然是首选选项,因为它的大小要小一个数量级。
创建
www/wms-vectortilesGeoserver数据目录中的目录。下载 latest version of OpenLayers 。下载v<ol-Version>-Package.zip文件。
将以下文件从下载的归档文件解压缩到步骤1中创建的目录:
v<ol-version>-package/dist/ol.jsv<ol-version>-package/ol.css
在文本编辑器中,创建包含以下内容的新文件:
<!doctype html>
<html>
<head>
  <title>Vector tiles</title>
  <script src="ol.js"></script>
  <link rel="stylesheet" href="ol.css">
  <style>
    html, body {
      font-family: sans-serif;
      width: 100%;
    }
    .map {
      height: 500px;
      width: 100%;
    }
  </style>
</head>
<body>
  <h3>Mapbox Protobuf - vector tiles WMS</h3>
  <div class="refresh-container">
  <button id="refresh-button" type="button" onclick="updateFunc();">Refresh/reload cache</button>
  </div>
  <div id="map" class="map"></div>
  <script>

    var layerParams = {'LAYERS': 'opengeo:countries', 'TILED': false, 'FORMAT': 'application/vnd.mapbox-vector-tile'};

  var sourceOptions = {
      url: '/geoserver/wms?',
      params: layerParams,
      serverType: 'geoserver',
      transition: 0,
      hidpi: false
    };

  var WMSTileSource = new ol.source.TileWMS(sourceOptions);

  var mvtVectorSource = new ol.source.VectorTile(
    Object.assign(
      sourceOptions,
      {
        url: undefined,
        format: new ol.format.MVT({layerName: '_layer_'}),
        tileUrlFunction: function(tileCoord, pixelRatio, projection) {
          return WMSTileSource.tileUrlFunction(tileCoord, pixelRatio, projection);
        }
      }
    )
  );


    var updateFunc = function () {
    WMSTileSource.updateParams(
      Object.assign(
        layerParams,
        {
          '_v_' : Date.now()
        }
      )
    );
    WMSTileSource.tileCache.pruneExceptNewestZ();
    mvtVectorSource.clear();
    mvtVectorSource.refresh();
  };


  var layer = new ol.layer.VectorTile({
    source: mvtVectorSource
  });

  var map = new ol.Map({
    target: 'map',
    view: new ol.View({
      center: [0,0],
      zoom: 2
    }),
    layers: [layer]
  });

  </script>
</body>
</html>
将此文件保存在上面创建的目录中
index.html.导航到
http://localhost:8080/geoserver/www/wms-vectortiles/index.html并验证输出是否显示没有任何错误。备注
如果您的地理服务器部署在
http://localhost:8080/geoserver/,则请调整上述URL。
样式向量图块
因为这些图块是在客户机中呈现的,所以我们只需要更改客户机应用程序中的样式说明。不需要更改geoserver,不必重新生成块。
将填充颜色更改为浅绿色:
var style_simple = new ol.style.Style({
  fill: new ol.style.Fill({
    color: 'lightgreen'
  }),
   stroke: new ol.style.Stroke({
      color: '#880000',
      width: 1
    })
}) ;
保存文件并重新加载应用程序。
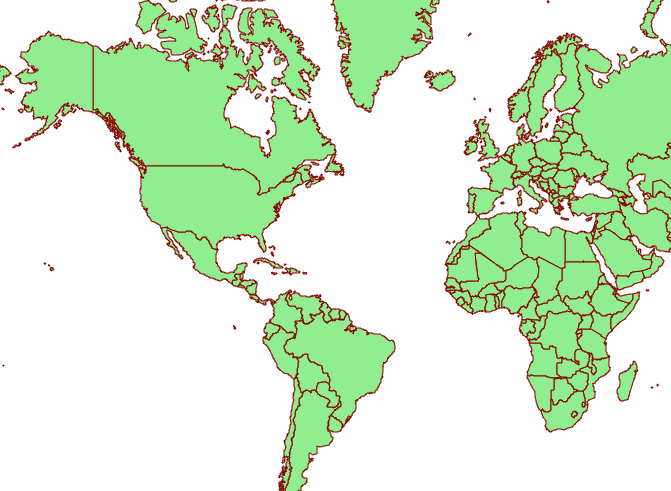
交替颜色矢量图块输出
我们也可以做基于属性的样式。此数据集包含一个属性 (
region_un)它包含国家所在的地区。让我们通过在现有样式下面添加另一个样式定义来突出非洲国家:var style_highlighted = new ol.style.Style({ fill: new ol.style.Fill({ color: 'yellow' }), stroke: new ol.style.Stroke({ color: '#880000', width: 1 }) });替换现有样式函数:
 function simpleStyle(feature) {
   return style_simple;
 }
包括以下内容:
 function simpleStyle(feature) {
   if (feature.get("region_un") == "Africa") {
     return style_highlighted;
   }
   return style_simple;
 }
保存文件并重新加载应用程序。
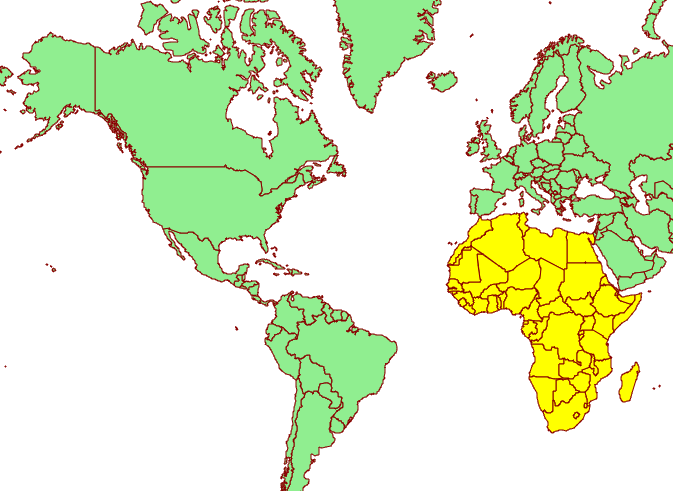
突出显示非洲的矢量图块输出