动态颜色映射生成
ras:DynamicColorMap 是一个 Raster-to-Raster 渲染转换,在栅格的统计数据和一组颜色的基础上,将动态颜色映射应用于栅格。
安装动态颜色映射社区扩展
从下载该扩展模块 nightly GeoServer community module builds 。
警告
请确保将扩展的版本与geoserver实例的版本匹配!
将存档的内容提取到
WEB-INF/lib地理服务器安装目录。
使用
下面的SLD使用Quantumgis SVG文件上创建的颜色映射调用覆盖范围上的动态颜色映射渲染转换。动态颜色映射渲染转换将数据作为第一个参数(覆盖率),颜色渐变作为第二个参数(颜色映射)。
 1<?xml version="1.0" encoding="ISO-8859-1"?>
 2<StyledLayerDescriptor version="1.0.0"
 3    xsi:schemaLocation="http://www.opengis.net/sld StyledLayerDescriptor.xsd"
 4    xmlns="http://www.opengis.net/sld"
 5    xmlns:ogc="http://www.opengis.net/ogc"
 6    xmlns:xlink="http://www.w3.org/1999/xlink"
 7    xmlns:xsi="http://www.w3.org/2001/XMLSchema-instance">
 8  <NamedLayer>
 9    <Name>DynamicColorMap</Name>
10    <UserStyle>
11      <Title>DynamicColorMap</Title>
12      <Abstract>A DynamicColorMap</Abstract>
13      <FeatureTypeStyle>
14        <Transformation>
15          <ogc:Function name="ras:DynamicColorMap">
16            <ogc:Function name="parameter">
17              <ogc:Literal>data</ogc:Literal>
18            </ogc:Function>
19            <ogc:Function name="parameter">
20              <ogc:Literal>colorRamp</ogc:Literal>
21              <ogc:Function name="colormap">
22                <ogc:Literal>gmt\GMT_panoply</ogc:Literal>
23                <ogc:Function name="gridCoverageStats"><ogc:Literal>minimum</ogc:Literal></ogc:Function>
24                <ogc:Function name="gridCoverageStats"><ogc:Literal>maximum</ogc:Literal></ogc:Function>
25              </ogc:Function>
26            </ogc:Function>
27          </ogc:Function>
28        </Transformation>
29        <Rule>
30         <Name>rule1</Name>
31         <RasterSymbolizer>
32           <Opacity>1.0</Opacity>
33         </RasterSymbolizer>
34        </Rule>
35      </FeatureTypeStyle>
36    </UserStyle>
37  </NamedLayer>
38 </StyledLayerDescriptor>
SLD的关键方面包括:
Lines 14-15 使用该过程定义渲染转换
ras:DynamicColorMap.Lines 16-18 提供输入数据参数,名为
data在这个过程中。Lines 19-21 为流程的
colorRamp指定颜色映射的参数。Lines 22-23 提供的值
colorMap参数。在本例中,它是对包含线性半径定义的SVG的引用。Quantumgis SVG LinearGradient子元素示例如下:
<linearGradient id="GMT_panoply" gradientUnits="objectBoundingBox" spreadMethod="pad" x1="0%" x2="100%" y1="0%" y2="0%">
    <stop offset="0.00%" stop-color="rgb(4,14,216)" stop-opacity="1.0000"/>
    <stop offset="6.25%" stop-color="rgb(4,14,216)" stop-opacity="1.0000"/>
    <stop offset="6.25%" stop-color="rgb(32,80,255)" stop-opacity="1.0000"/>
    <stop offset="12.50%" stop-color="rgb(32,80,255)" stop-opacity="1.0000"/>
    <stop offset="12.50%" stop-color="rgb(65,150,255)" stop-opacity="1.0000"/>
    <stop offset="18.75%" stop-color="rgb(65,150,255)" stop-opacity="1.0000"/>
    <stop offset="18.75%" stop-color="rgb(109,193,255)" stop-opacity="1.0000"/>
    <stop offset="25.00%" stop-color="rgb(109,193,255)" stop-opacity="1.0000"/>
    <stop offset="25.00%" stop-color="rgb(134,217,255)" stop-opacity="1.0000"/>
    <stop offset="31.25%" stop-color="rgb(134,217,255)" stop-opacity="1.0000"/>
    <stop offset="31.25%" stop-color="rgb(156,238,255)" stop-opacity="1.0000"/>
    <stop offset="37.50%" stop-color="rgb(156,238,255)" stop-opacity="1.0000"/>
    <stop offset="37.50%" stop-color="rgb(175,245,255)" stop-opacity="1.0000"/>
    <stop offset="43.75%" stop-color="rgb(175,245,255)" stop-opacity="1.0000"/>
    <stop offset="43.75%" stop-color="rgb(206,255,255)" stop-opacity="1.0000"/>
    <stop offset="50.00%" stop-color="rgb(206,255,255)" stop-opacity="1.0000"/>
    <stop offset="50.00%" stop-color="rgb(255,254,71)" stop-opacity="1.0000"/>
    <stop offset="56.25%" stop-color="rgb(255,254,71)" stop-opacity="1.0000"/>
    <stop offset="56.25%" stop-color="rgb(255,235,0)" stop-opacity="1.0000"/>
    <stop offset="62.50%" stop-color="rgb(255,235,0)" stop-opacity="1.0000"/>
    <stop offset="62.50%" stop-color="rgb(255,196,0)" stop-opacity="1.0000"/>
    <stop offset="68.75%" stop-color="rgb(255,196,0)" stop-opacity="1.0000"/>
    <stop offset="68.75%" stop-color="rgb(255,144,0)" stop-opacity="1.0000"/>
    <stop offset="75.00%" stop-color="rgb(255,144,0)" stop-opacity="1.0000"/>
    <stop offset="75.00%" stop-color="rgb(255,72,0)" stop-opacity="1.0000"/>
    <stop offset="81.25%" stop-color="rgb(255,72,0)" stop-opacity="1.0000"/>
    <stop offset="81.25%" stop-color="rgb(255,0,0)" stop-opacity="1.0000"/>
    <stop offset="87.50%" stop-color="rgb(255,0,0)" stop-opacity="1.0000"/>
    <stop offset="87.50%" stop-color="rgb(213,0,0)" stop-opacity="1.0000"/>
    <stop offset="93.75%" stop-color="rgb(213,0,0)" stop-opacity="1.0000"/>
    <stop offset="93.75%" stop-color="rgb(158,0,0)" stop-opacity="1.0000"/>
    <stop offset="100.00%" stop-color="rgb(158,0,0)" stop-opacity="1.0000"/>
</linearGradient>
应该这样呈现:

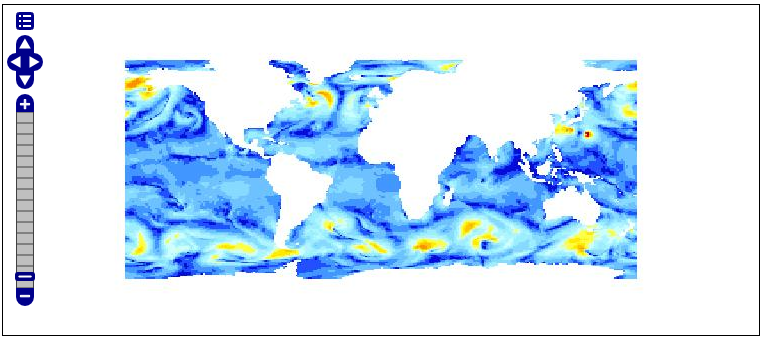
第24行 供应
minimum通过FilterFunction确定的参数,FilterFunction从GridCoverage统计中获取最小值,第25行 供应
maximum通过FilterFunction确定的参数,FilterFunction从GridCoverage统计中获取最大值,生成的图像可能如下所示(您可能会注意到由于颜色间隔而导致的跨颜色步骤):
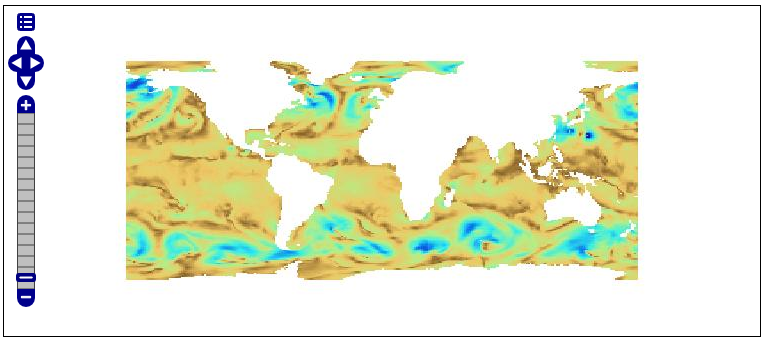
使用gmt_drywet svg,生成的图像可能如下所示,使用更平滑的颜色渐变:
或者,可以通过以下方式指定颜色映射:
..........
           <ogc:Function name="ras:DynamicColorMap">
             <ogc:Function name="parameter">
               <ogc:Literal>data</ogc:Literal>
             </ogc:Function>
             <ogc:Function name="parameter">
               <ogc:Literal>colorRamp</ogc:Literal>
               <ogc:Function name="colormap">
                 <ogc:Literal>#0000FF;#00FF00;#FF0000</ogc:Literal>
                 <ogc:Function name="gridCoverageStats"><ogc:Literal>minimum</ogc:Literal></ogc:Function>
                 <ogc:Function name="gridCoverageStats"><ogc:Literal>maximum</ogc:Literal></ogc:Function>
               </ogc:Function>
             </ogc:Function>
           </ogc:Function>
...........
或
..........
           <ogc:Function name="ras:DynamicColorMap">
             <ogc:Function name="parameter">
               <ogc:Literal>data</ogc:Literal>
             </ogc:Function>
             <ogc:Function name="parameter">
               <ogc:Literal>colorRamp</ogc:Literal>
               <ogc:Function name="colormap">
                 <ogc:Literal>rgb(0,0,255);rgb(0,255,0);rgb(255,0,0)</ogc:Literal>
                 <ogc:Function name="gridCoverageStats"><ogc:Literal>minimum</ogc:Literal></ogc:Function>
                 <ogc:Function name="gridCoverageStats"><ogc:Literal>maximum</ogc:Literal></ogc:Function>
               </ogc:Function>
             </ogc:Function>
           </ogc:Function>
...........
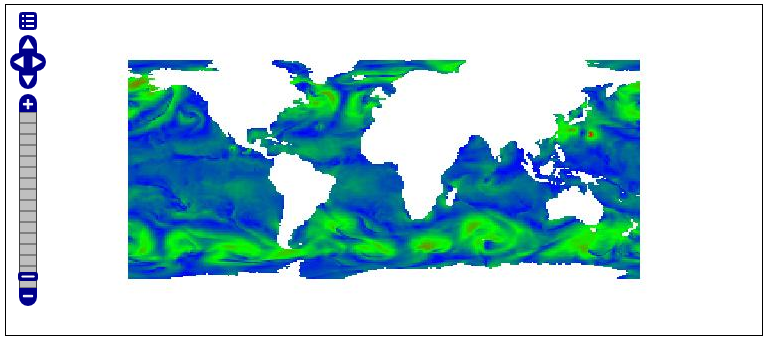
在这些情况下,斜坡将与指示的颜色一起使用。
生成的图像可能如下所示:
动态颜色图要求
预科医师 gdalinfo -stats 为了创建包含统计信息和元数据的PAM辅助文件,需要对coverage运行命令。
为了从Quantumgis设置颜色映射,您应该从中复制Quantumgis SVG资源文件夹 apps/qgis/resources/cpt-city-XXXXX 内 GEOSERVER_DATA_DIR 作为一个 styles/ramps 子文件夹。
底层读取器应通过添加PAMDataset对象作为返回覆盖率的属性来支持统计信息检索。因此,用户应该注意设置 CheckAuxiliaryMetadata 旗到 true 里面 indexer.properties 或者更新 。属性 GeoServer在已配置存储的情况下使用该标志生成的文件(在这种情况下还需要重新加载配置)。