备注
单击 here 要下载完整的示例代码,请执行以下操作
将三色图像(JPG)转换为单独的FITS图像
此示例打开一个RGB JPEG图像,并将每个通道作为单独的FITS(图像)文件写出。
此示例使用 pillow 要读图像, matplotlib.pyplot 显示图像,以及 astropy.io.fits 保存配合文件。
By: Erik Bray, Adrian Price-Whelan
许可证:BSD
import numpy as np
from PIL import Image
from astropy.io import fits
设置matplotlib并使用一组更好的绘图参数
import matplotlib.pyplot as plt
from astropy.visualization import astropy_mpl_style
plt.style.use(astropy_mpl_style)
加载并显示原始的3色jpeg图像:
image = Image.open('Hs-2009-14-a-web.jpg')
xsize, ysize = image.size
print(f"Image size: {ysize} x {xsize}")
print(f"Image bands: {image.getbands()}")
ax = plt.imshow(image)
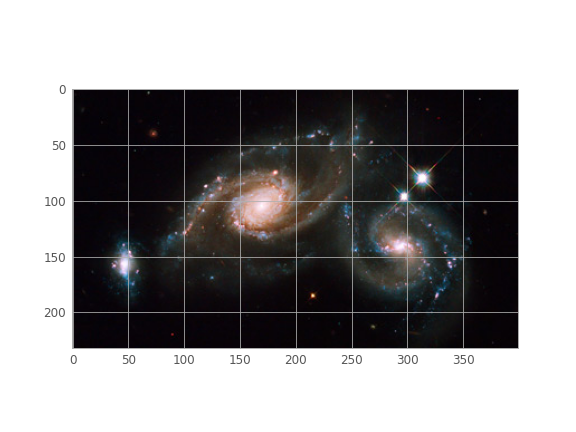
Image size: 232 x 400
Image bands: ('R', 'G', 'B')
分割三个通道(RGB)并将数据作为Numpy数组获取。阵列是扁平的,因此它们是一维的:
r, g, b = image.split()
r_data = np.array(r.getdata()) # data is now an array of length ysize*xsize
g_data = np.array(g.getdata())
b_data = np.array(b.getdata())
print(r_data.shape)
(92800,)
将图像阵列重塑为二维:
r_data = r_data.reshape(ysize, xsize) # data is now a matrix (ysize, xsize)
g_data = g_data.reshape(ysize, xsize)
b_data = b_data.reshape(ysize, xsize)
print(r_data.shape)
(232, 400)
把通道写成单独的FITS图像。添加和可视化标题信息
red = fits.PrimaryHDU(data=r_data)
red.header['LATOBS'] = "32:11:56" # add spurious header info
red.header['LONGOBS'] = "110:56"
red.writeto('red.fits')

green = fits.PrimaryHDU(data=g_data)
green.header['LATOBS'] = "32:11:56"
green.header['LONGOBS'] = "110:56"
green.writeto('green.fits')

blue = fits.PrimaryHDU(data=b_data)
blue.header['LATOBS'] = "32:11:56"
blue.header['LONGOBS'] = "110:56"
blue.writeto('blue.fits')

from pprint import pprint
pprint(red.header)
SIMPLE  =                    T / conforms to FITS standard
BITPIX  =                   64 / array data type
NAXIS   =                    2 / number of array dimensions
NAXIS1  =                  400
NAXIS2  =                  232
EXTEND  =                    T
LATOBS  = '32:11:56'
LONGOBS = '110:56  '
删除创建的文件
import os
os.remove('red.fits')
os.remove('green.fits')
os.remove('blue.fits')
Total running time of the script: (0分0.173秒)