11. 空间分析(插值法)
|
目标: |
将内插理解为空间分析的一部分 |
关键词: |
点数据,内插法,反距离加权,不规则三角网 |

11.1. 概述
Spatial analysis 是处理空间信息以从原始数据中提取新的信息和意义的过程。通常利用地理信息系统(GIS)进行空间分析。地理信息系统通常提供空间分析工具,用于计算要素统计数据和执行地理处理活动,如数据内插。在水文学方面,用户可能会强调地形分析和水文建模(对水在地球上和地球内的运动进行建模)的重要性。在野生动物管理中,用户对处理野生动物点位置及其与环境的关系的分析功能感兴趣。每个用户都会根据他们所做的工作类型而对不同的事情感兴趣。
11.2. 详细的空间内插
Spatial interpolation is the process of using points with known values to estimate values at other unknown points. For example, to make a precipitation (rainfall) map for your country, you will not find enough evenly spread weather stations to cover the entire region. Spatial interpolation can estimate the temperatures at locations without recorded data by using known temperature readings at nearby weather stations (see 图 11.37). This type of interpolated surface is often called a statistical surface. Elevation data, precipitation, snow accumulation, water table and population density are other types of data that can be computed using interpolation.

图 11.37 从南非气象站插入的温度图。
由于成本高和资源有限,数据收集通常只在有限数量的选定点位进行。在GIS中,可以应用这些点的空间内插来创建栅格曲面,并对所有栅格单元进行估计。
为了根据GPS设备测量的高程点生成连续地图,例如数字高程图,必须使用适当的内插方法来最佳地估计那些未进行采样或测量的位置的值。然后,内插分析的结果可用于覆盖整个区域的分析和建模。
插补方法有很多种。在这个介绍中,我们将介绍两种广泛使用的插补方法,称为 Inverse Distance Weighting (IDW)和 Triangulated Irregular Networks (锡)。如果您正在寻找其他的插补方法,请参考本主题结尾处的“进一步阅读”部分。
11.3. 反距离加权(IDW)
In the IDW interpolation method, the sample points are weighted during interpolation such that the influence of one point relative to another declines with distance from the unknown point you want to create (see 图 11.38).

图 11.38 基于加权采样点距离的反距离加权内插(左)。从高程矢量点插补IDW曲面(右)。图片来源:Mitas,L.,Mitasova,H.(1999)。
通过使用加权系数将权重指定给采样点,该系数控制加权影响将如何随着与新点的距离增加而下降。加权系数越大,插补过程中距离未知点越远的影响点越小。随着系数的增加,未知点的值接近最近观测点的值。
It is important to notice that the IDW interpolation method also has some disadvantages: the quality of the interpolation result can decrease, if the distribution of sample data points is uneven. Furthermore, maximum and minimum values in the interpolated surface can only occur at sample data points. This often results in small peaks and pits around the sample data points as shown in 图 11.38.
In GIS, interpolation results are usually shown as a 2 dimensional raster layer. In 图 11.39, you can see a typical IDW interpolation result, based on elevation sample points collected in the field with a GPS device.
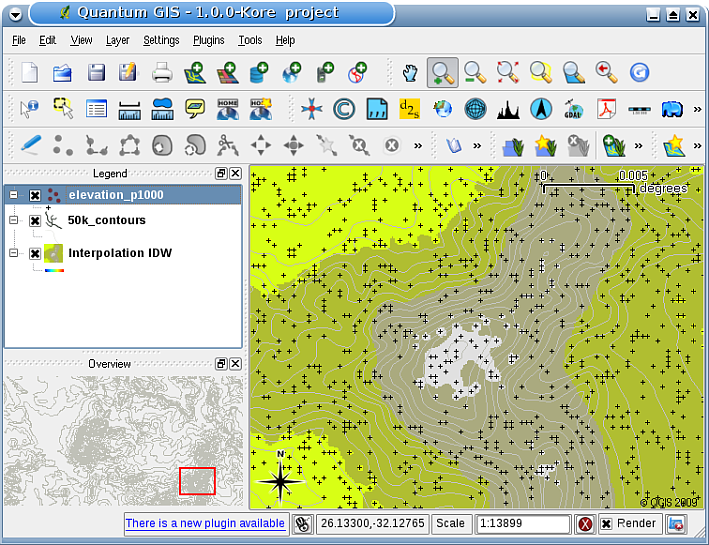
图 11.39 IDW内插由不规则采集的高程采样点(显示为黑色十字)产生。
11.4. 不规则三角网(TIN)
TIN interpolation is another popular tool in GIS. A common TIN algorithm is called Delaunay triangulation. It tries to create a surface formed by triangles of nearest neighbour points. To do this, circumcircles around selected sample points are created and their intersections are connected to a network of non overlapping and as compact as possible triangles (see 图 11.40).
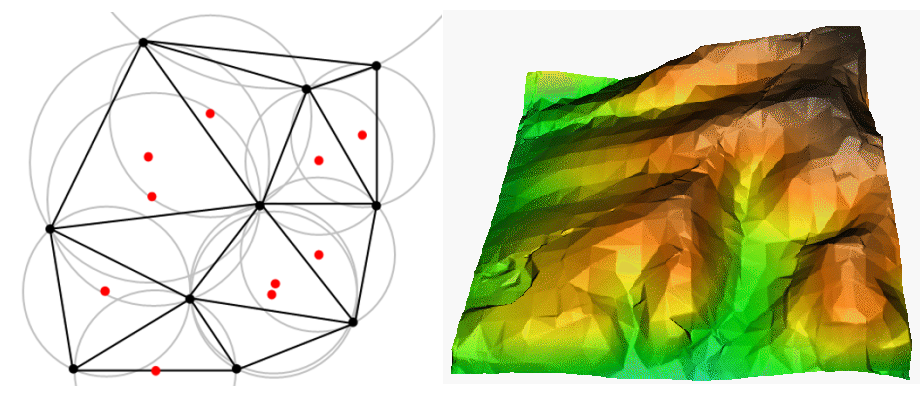
图 11.40 红色样本数据外接圆的Delaunay三角剖分。从高程矢量点创建的结果内插三角网曲面显示在右侧。图片来源:Mitas,L.,Mitasova,H.(1999)。
The main disadvantage of the TIN interpolation is that the surfaces are not smooth and may give a jagged appearance. This is caused by discontinuous slopes at the triangle edges and sample data points. In addition, triangulation is generally not suitable for extrapolation beyond the area with collected sample data points (see 图 11.41 ).
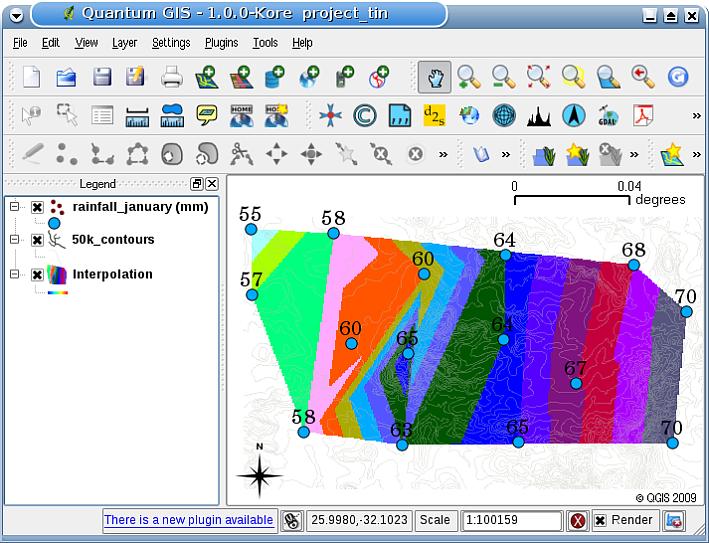
图 11.41 不规则采集的雨量采样点的Delaunay三角网内插结果(蓝色圆圈)
11.5. 需要注意的常见问题/事情
重要的是要记住,没有一种插补方法可以适用于所有情况。有些方法比其他方法更准确、更有用,但需要更长的计算时间。它们都有优点和缺点。在实践中,特定的插补方法的选择应该取决于样本数据、要生成的曲面的类型和估计误差的容限。通常,建议使用三个步骤的程序:
评估样本数据。这样做是为了了解数据在该区域中的分布方式,因为这可能会提供有关使用哪种内插方法的提示。
采用最适合样本数据和研究目标的内插方法。当您有疑问时,尝试几种方法(如果可行)。
比较结果,找出最好的结果和最合适的方法。一开始,这可能看起来像是一个耗时的过程。但是,随着您获得不同插补方法的经验和知识,生成最合适的曲面所需的时间将大大减少。
11.6. 其他插补方法
虽然我们在本工作表中重点介绍了IDW和TIN插值法,但在地理信息系统中提供了更多的空间插值法,如带张力的正则化样条(RST)、克立格法或趋势面插值法。有关网络链接,请参阅下面的附加阅读部分。
11.7. 我们学到了什么?
让我们总结一下我们在此工作表中介绍的内容:
Interpolation 使用具有已知值的矢量点来估计未知位置的值,以创建覆盖整个区域的栅格曲面。
内插结果通常是一个 raster 一层。
重要的是要 find a suitable interpolation method 以最佳方式估计未知位置的值。
IDW interpolation 为采样点赋予权重,使一个点对另一个点的影响随着与要估计的新点的距离而下降。
TIN interpolation 使用采样点基于最近邻点信息创建由三角形形成的曲面。
11.8. 现在你来试试吧!
以下是一些建议,可供您尝试与您的学习者:
农业部计划在你的地区开垦新的土地,但除了土壤的特性外,他们还想知道降雨量是否足以获得好收成。他们掌握的所有信息都来自该地区的几个气象站。与您的学员一起创建一个插值面,显示哪些地区可能获得最大降雨量。
旅游局希望公布1月和2月的天气情况。他们有温度、降雨量和风力数据,并要求你对他们的数据进行内插,以估计游客可能在温度温和、没有降雨和风力较小的情况下拥有最佳天气条件的地方。你能找出你所在地区符合这些标准的地区吗?
11.9. 一些值得思考的事情
如果你没有可用的计算机,你可以使用地形图和尺子来估计等高线之间的高程值或虚构气象站之间的降雨值。例如,如果A气象站的降雨量为每月50毫米,B气象站的降雨量为90毫米,则可以估计A气象站和B气象站之间距离的一半处的降雨量为70毫米。
11.10. 进一步阅读
Books :
张康宗(2006)。地理信息系统概论。第三版。麦格劳·希尔。ISBN:0070658986
德默斯(2005):地理信息系统基础。第三版。威利。ISBN:9814126195
米塔斯,L.,米塔索娃,H.(1999)。空间内插。收录于:P.Longley,M.F.GoodChild,D.J.Maguire,D.W.Rhind(编辑),地理信息系统:原理,技术,管理和应用,Wiley。
Websites :
《QGIS用户指南》还提供了有关QGIS中提供的插补工具的更多详细信息。
11.11. 下一步是什么?
这是本系列的最后一张工作表。我们鼓励您探索QGIS,并使用随附的QGIS手册来了解您可以使用GIS软件做的所有其他事情!