pysal.viz.splot.esda.plot_moran_simulation
-
pysal.viz.splot.esda.plot_moran_simulation(moran, ax=None, fitline_kwds=None, **kwargs)[源代码]¶ 全球莫兰I模拟参考分布。
参数: - moran : esda.moran.moran实例
莫兰I全球自相关统计值
- ax : Matplotlib轴实例,可选
如果给定,将在此轴内创建Moran图。缺省=无。
- fitline_kwds : 关键字参数,可选
用于创建和设计垂直Moran Fitline的关键字。缺省=无。
- **kwargs : 关键字参数,可选
用于创建和设计图形的关键字,传递给seaborn.kdeplot。
返回: - fig : Matplotlib图实例
模拟参考分布图
- ax : Matplotlib轴实例
绘制图形的轴
实例
进口
>>> import matplotlib.pyplot as plt
>>> from pysal.lib.weights.contiguity import Queen
>>> from pysal.lib import examples
>>> import geopandas as gpd
>>> from pysal.explore.esda.moran import Moran
>>> from pysal.viz.splot.esda import plot_moran_simulation
加载数据并计算权重
>>> link_to_data = examples.get_path('Guerry.shp')
>>> gdf = gpd.read_file(link_to_data)
>>> y = gdf['Donatns'].values
>>> w = Queen.from_dataframe(gdf)
>>> w.transform = 'r'
计算全局Moran
>>> moran = Moran(y, w)
情节
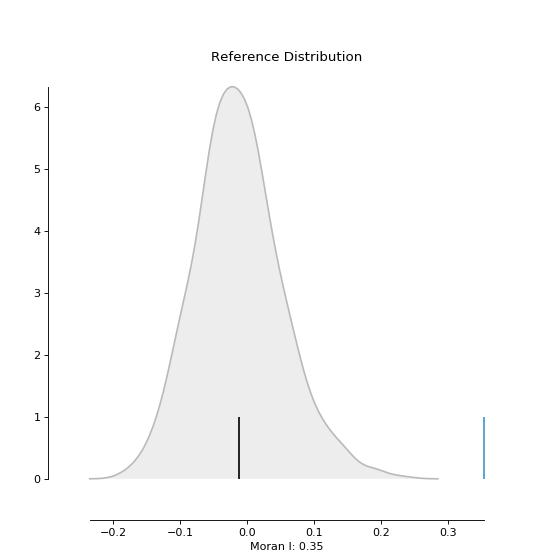
>>> plot_moran_simulation(moran)
>>> plt.show()
( Source code , png , hires.png , pdf )

定制图
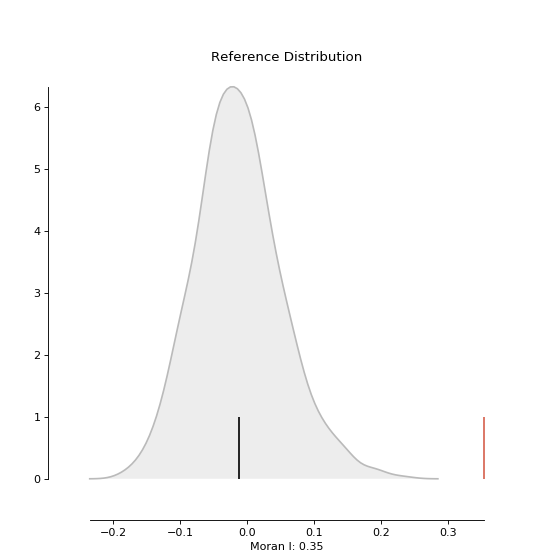
>>> plot_moran_simulation(moran, fitline_kwds=dict(color='#4393c3'))
>>> plt.show()