注解
Click here 下载完整的示例代码
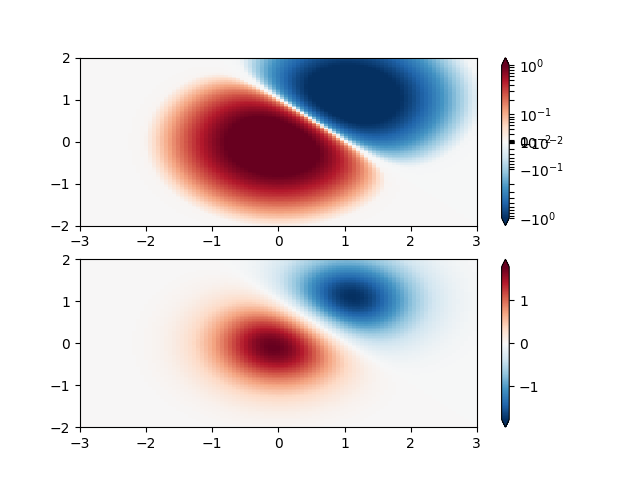
颜色映射规范化符号规范
演示如何使用norm以非线性方式将颜色映射到数据上。
出:
/pb1/rst_repos/git/matplotlib/examples/userdemo/colormap_normalizations_symlognorm.py:33: MatplotlibDeprecationWarning: shading='flat' when X and Y have the same dimensions as C is deprecated since 3.3.  Either specify the corners of the quadrilaterals with X and Y, or pass shading='auto', 'nearest' or 'gouraud', or set rcParams['pcolor.shading'].  This will become an error two minor releases later.
  cmap='RdBu_r')
/pb1/rst_repos/git/matplotlib/examples/userdemo/colormap_normalizations_symlognorm.py:36: MatplotlibDeprecationWarning: shading='flat' when X and Y have the same dimensions as C is deprecated since 3.3.  Either specify the corners of the quadrilaterals with X and Y, or pass shading='auto', 'nearest' or 'gouraud', or set rcParams['pcolor.shading'].  This will become an error two minor releases later.
  pcm = ax[1].pcolormesh(X, Y, Z, cmap='RdBu_r', vmin=-np.max(Z))
import numpy as np
import matplotlib.pyplot as plt
import matplotlib.colors as colors

"""
SymLogNorm: two humps, one negative and one positive, The positive
with 5-times the amplitude. Linearly, you cannot see detail in the
negative hump.  Here we logarithmically scale the positive and
negative data separately.

Note that colorbar labels do not come out looking very good.
"""

N = 100
X, Y = np.mgrid[-3:3:complex(0, N), -2:2:complex(0, N)]
Z1 = np.exp(-X**2 - Y**2)
Z2 = np.exp(-(X - 1)**2 - (Y - 1)**2)
Z = (Z1 - Z2) * 2

fig, ax = plt.subplots(2, 1)

pcm = ax[0].pcolormesh(X, Y, Z,
                       norm=colors.SymLogNorm(linthresh=0.03, linscale=0.03,
                                              vmin=-1.0, vmax=1.0, base=10),
                       cmap='RdBu_r')
fig.colorbar(pcm, ax=ax[0], extend='both')

pcm = ax[1].pcolormesh(X, Y, Z, cmap='RdBu_r', vmin=-np.max(Z))
fig.colorbar(pcm, ax=ax[1], extend='both')

plt.show()
关键词:matplotlib代码示例,codex,python plot,pyplot Gallery generated by Sphinx-Gallery