注解
Click here 下载完整的示例代码
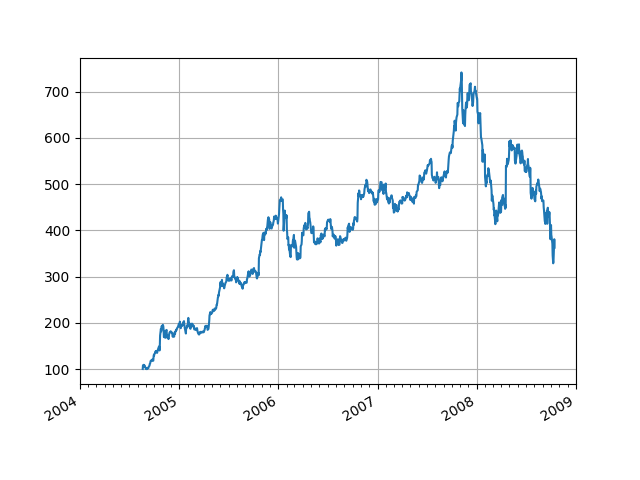
日期刻度线标签
演示如何使用日期刻度定位器和格式化程序在Matplotlib中生成日期图。看到了吗 主次滴答声 有关控制主要刻度和次要刻度的详细信息。
所有Matplotlib日期打印都是通过将日期实例转换为自0001-01-01 00:00:00 UTC加上一天(出于历史原因)后的天来完成的。转换、记号定位和格式化都是在后台完成的,所以这对您来说是最透明的。这个 matplotlib.dates 模块提供转换器功能 date2num 和 num2date ,转换为 datetime.datetime 和 numpy.datetime64 对象与Matplotlib的内部表示形式之间的交互。
import numpy as np
import matplotlib.pyplot as plt
import matplotlib.dates as mdates
import matplotlib.cbook as cbook

years = mdates.YearLocator()   # every year
months = mdates.MonthLocator()  # every month
years_fmt = mdates.DateFormatter('%Y')

# Load a numpy structured array from yahoo csv data with fields date, open,
# close, volume, adj_close from the mpl-data/example directory.  This array
# stores the date as an np.datetime64 with a day unit ('D') in the 'date'
# column.
data = cbook.get_sample_data('goog.npz', np_load=True)['price_data']

fig, ax = plt.subplots()
ax.plot('date', 'adj_close', data=data)

# format the ticks
ax.xaxis.set_major_locator(years)
ax.xaxis.set_major_formatter(years_fmt)
ax.xaxis.set_minor_locator(months)

# round to nearest years.
datemin = np.datetime64(data['date'][0], 'Y')
datemax = np.datetime64(data['date'][-1], 'Y') + np.timedelta64(1, 'Y')
ax.set_xlim(datemin, datemax)

# format the coords message box
ax.format_xdata = mdates.DateFormatter('%Y-%m-%d')
ax.format_ydata = lambda x: '$%1.2f' % x  # format the price.
ax.grid(True)

# rotates and right aligns the x labels, and moves the bottom of the
# axes up to make room for them
fig.autofmt_xdate()

plt.show()
关键词:matplotlib代码示例,codex,python plot,pyplot Gallery generated by Sphinx-Gallery