注解
Click here 下载完整的示例代码
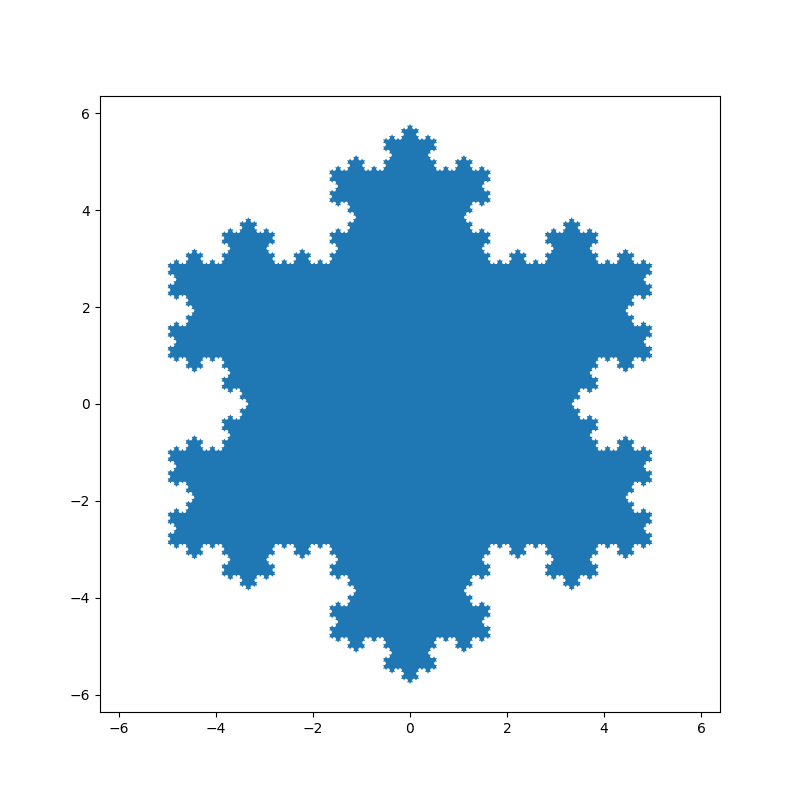
填充多边形
fill() 基于点坐标列表绘制填充多边形 x , y .
此示例使用 Koch snowflake 例如多边形。
import numpy as np
import matplotlib.pyplot as plt


def koch_snowflake(order, scale=10):
    """
    Return two lists x, y of point coordinates of the Koch snowflake.

    Arguments
    ---------
    order : int
        The recursion depth.
    scale : float
        The extent of the snowflake (edge length of the base triangle).
    """
    def _koch_snowflake_complex(order):
        if order == 0:
            # initial triangle
            angles = np.array([0, 120, 240]) + 90
            return scale / np.sqrt(3) * np.exp(np.deg2rad(angles) * 1j)
        else:
            ZR = 0.5 - 0.5j * np.sqrt(3) / 3

            p1 = _koch_snowflake_complex(order - 1)  # start points
            p2 = np.roll(p1, shift=-1)  # end points
            dp = p2 - p1  # connection vectors

            new_points = np.empty(len(p1) * 4, dtype=np.complex128)
            new_points[::4] = p1
            new_points[1::4] = p1 + dp / 3
            new_points[2::4] = p1 + dp * ZR
            new_points[3::4] = p1 + dp / 3 * 2
            return new_points

    points = _koch_snowflake_complex(order)
    x, y = points.real, points.imag
    return x, y
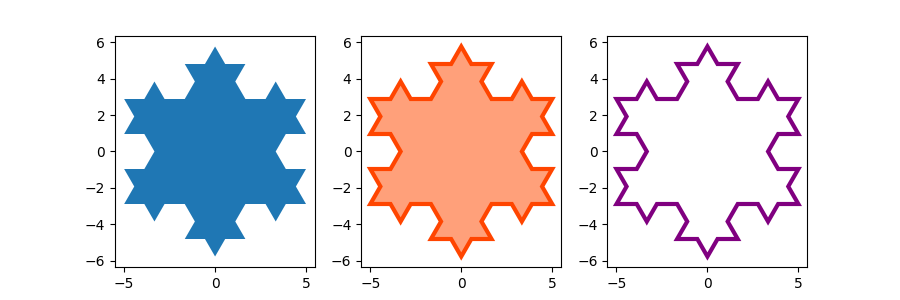
基本用法:
使用关键字参数 脸色 和 变色染料 修改多边形的颜色。自从 线宽 如果默认Matplotlib样式中的边为0,则必须将其设置为使边可见。
工具书类
以下函数、方法、类和模块的使用如本例所示:
出:
<function axis at 0x7faa00cf8bf8>
脚本的总运行时间: (0分1.082秒)
关键词:matplotlib代码示例,codex,python plot,pyplot Gallery generated by Sphinx-Gallery