摘要: 下载basemap 下载完成后解压basemap 安装依赖库 直接使用python setup.py install 安装会提示缺少geos库,为了方便把相关库都安装上.以下命令在终端都是以超级用户运行 apt-get install libgeos* 最好把...
下载basemap
下载完成后解压basemap
安装依赖库
直接使用python setup.py install 安装会提示缺少geos库,为了方便把相关库都安装上.以下命令在终端都是以超级用户运行
apt-get install libgeos*最好把gdal库也安装上
apt-get install libgdal*安装python依赖库
apt-get install python-dev
apt-get install python3-dev
checkinstall安装basemap
首先安装checkinstall
apt-get install checkinstall然后进入到解压后的目录
checkinstall python setup.py install或者
checkinstall python3 setup.py installl使用checkinstall安装的时候会有一些提示,直接enter跳过即可,最后生成的.deb包,生成后自动安装.
如果不出意外的话便可成功安装了,如果还出现其他错误就根据错误贴到网上自己查找一下.
参考链接:https://answers.launchpad.net/ubuntu/+source/matplotlib/+question/55943
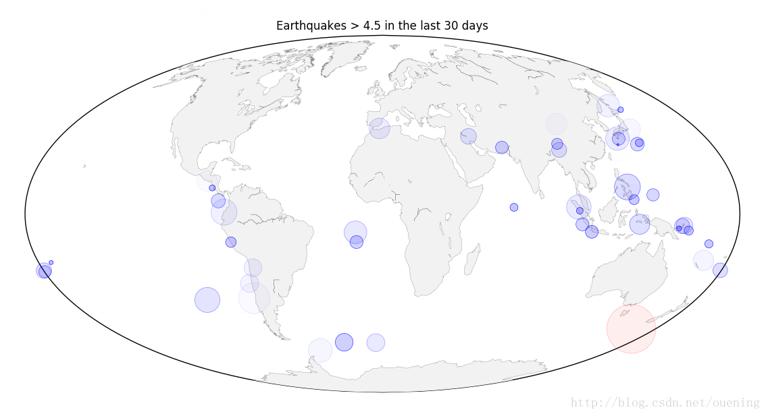
最后分享一段代码,用来生成过去一个月强度大于4.5的地震发生地点.
# -----------------------------------------------------------------------------
# Copyright (c) 2014, Nicolas P. Rougier. All Rights Reserved.
# Distributed under the (new) BSD License.
# -----------------------------------------------------------------------------
# Based on : https://peak5390.wordpress.com
# -> 2012/12/08/matplotlib-basemap-tutorial-plotting-global-earthquake-activity/
# -----------------------------------------------------------------------------
import urllib
import numpy as np
import matplotlib
matplotlib.rcParams['toolbar'] = 'None'
import matplotlib.pyplot as plt
from mpl_toolkits.basemap import Basemap
from  matplotlib.animation import FuncAnimation

# Open the earthquake data
# -------------------------
# -> 网址是:http://earthquake.usgs.gov/earthquakes/feed/v1.0/csv.php
feed = "http://earthquake.usgs.gov/earthquakes/feed/v1.0/summary/"

# Significant earthquakes in the past 30 days     过去30天发生的强大地震
# url = urllib.urlopen(feed + "significant_month.csv")

# Earthquakes of magnitude > 4.5 in the past 30 days 过去30天发生的强度大于4.5的地震
url = urllib.request.urlopen(feed + "4.5_month.csv") #Python3.5使用这个
# url = urllib.urlopen(feed + "4.5_month.csv")        #Python2.7使用这个

# Earthquakes of magnitude > 2.5 in the past 30 days 过去30天发生的强度大于2.5的地震
# url = urllib.urlopen(feed + "2.5_month.csv")

# Earthquakes of magnitude > 1.0 in the past 30 days 过去30天发生的强度大于1的地震
# url = urllib.request.urlopen(feed + "1.0_month.csv")

# Earthquakes of all magnitude in the past 30 days 过去30天发生的全部地震
# url = urllib.request.urlopen(feed + "all_month.csv")


# Set earthquake data 设置地震数据
data = url.read()
data = data.split(b'\n')[+1:-1]
E = np.zeros(len(data), dtype=[('position',  float, 2),
                               ('magnitude', float, 1)])
for i in range(len(data)):
    row = data[i].split(b',')
    E['position'][i] = np.float(row[2]),np.float(row[1])
    E['magnitude'][i] = np.float(row[4])


fig = plt.figure(figsize=(14,10))
ax = plt.subplot(1,1,1)
P = np.zeros(50, dtype=[('position', float, 2),
                        ('size',     float, 1),
                        ('growth',   float, 1),
                        ('color',    float, 4)])

# Basemap projection
width = 28000000; lon_0 = -105; lat_0 = 40

map = Basemap(projection='moll',lon_0=0,resolution='c') #设置地图样式

map.drawcoastlines(color='0.50', linewidth=0.25)
map.fillcontinents(color='0.95')
scat = ax.scatter(P['position'][:,0], P['position'][:,1], P['size'], lw=0.5,
                  edgecolors = P['color'], facecolors='None', zorder=10)


def update(frame):
    current = frame % len(E)
    i = frame % len(P)

    P['color'][:,3] = np.maximum(0, P['color'][:,3] - 1.0/len(P))
    P['size'] += P['growth']

    magnitude = E['magnitude'][current]
    P['position'][i] = map(*E['position'][current])
    P['size'][i] = 5
    P['growth'][i]= np.exp(magnitude) * 0.1

    if magnitude < 6:
        P['color'][i]    = 0,0,1,1
    else:
        P['color'][i]    = 1,0,0,1
    scat.set_edgecolors(P['color'])
    scat.set_facecolors(P['color']*(1,1,1,0.25))
    scat.set_sizes(P['size'])
    scat.set_offsets(P['position'])

plt.title("Earthquakes > 4.5 in the last 30 days")
animation = FuncAnimation(fig, update, interval=10)

plt.show()
这里写图片描述